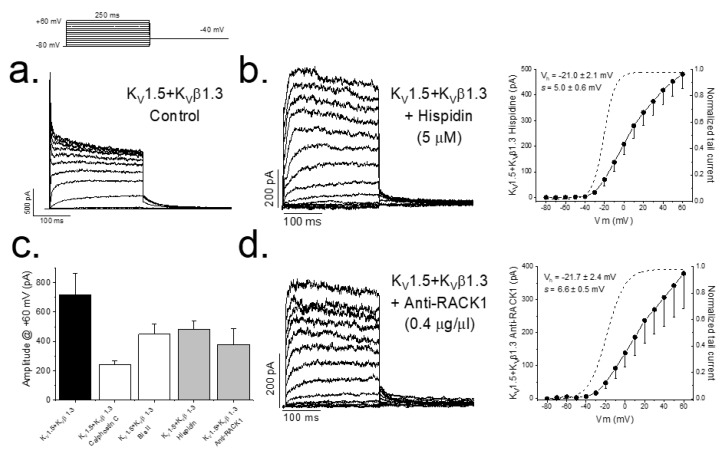
Figure 1.
PKC inhibition and RACK1 block results in a smaller magnitude of the KV1.5–KVβ1.3 current. Representative currents and I–V relationships in control conditions (a) along the activation curves, in a dashed line (right), after PKC inhibition with hispidin (b) and in the presence of anti-RACK1 antibody into the internal solution (d). Graphs shown in (c) show a summary of the magnitude KV1.5–KVβ1.3 current measured at the end of +60 mV depolarizing pulses under control conditions and after inhibition of PKC (with different inhibitors) and after RACK1 block with anti-RACK1 present in the internal solution. Note that data for calphostin C and bisindolylmaleimide II are taken from data previously reported in Macias et al., 2014 [10].

