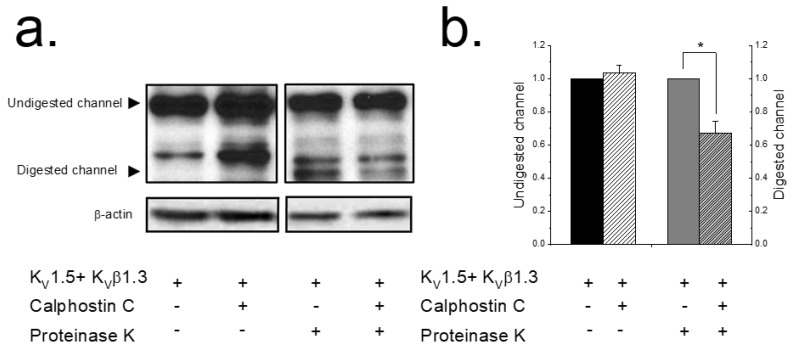
Figure 2.
PKC inhibition decreases the KV1.5–KVβ1.3 levels in the plasma membrane. HEK293 cells expressing KV1.5–KVβ1.3 channels treated or not with calphostin C (3 μM for 2 h). Cells were treated with buffer (lanes 1 and 2) or with proteinase K externally (lanes 3 and 4). Left panel shows a representative experiment (a). The two arrows indicate the molecular weight at which digested KV1.5 (surface channel) and undigested KV1.5 (intracellular form) appear. β-actin was used as a loading control. Densitometric analysis of 5 experiments as those shown in panel a. Black bars represent, normalized to control, total protein levels; grey bars, normalized to control, proteinase-K-digested KV1.5–KVβ1.3 channel as a representation of plasma membrane levels (b). Each value represents the mean ± SEM of five experiments. * p < 0.05.

