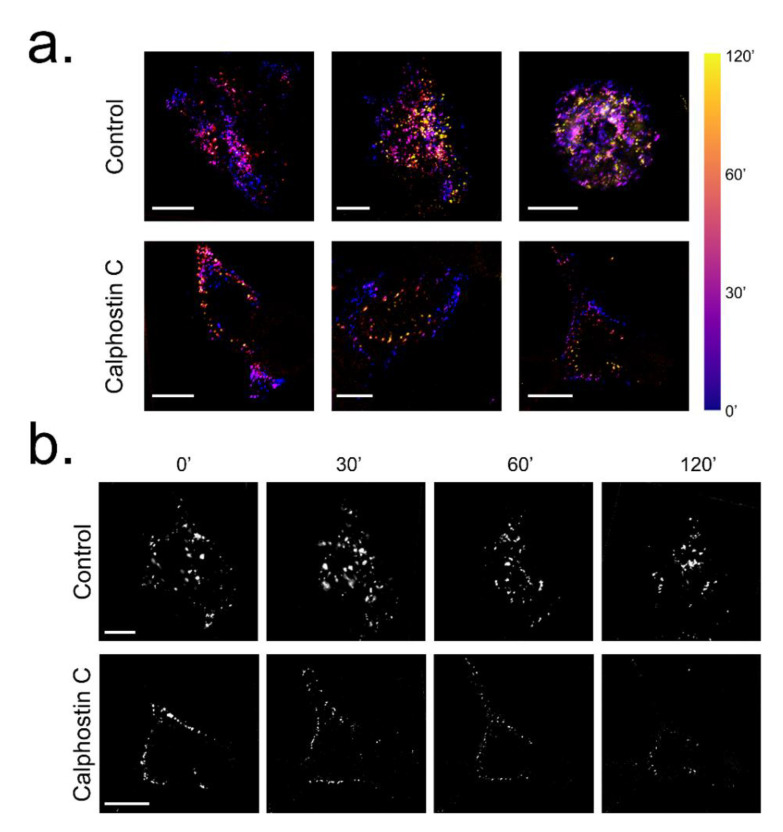
Figure 5.
Influence of PKC inhibition on KV1.5–HA–KVβ1.3 mobility in HEK293. (a) KV1.5–HA labelled by fluorescence staining of live cell under control conditions and after PKC inhibition by calphostin C treatment and visualized at different times. Bar colors show the time from the calphostin-induced PKC inhibition as the beginning of the experiment. (b) Frames extracted at 0, 30, 60 and 120 min from Supplemental Video 1A for control and Supplemental Video 2B for calphostin C. Scale bar represents 10 μm in all images.

