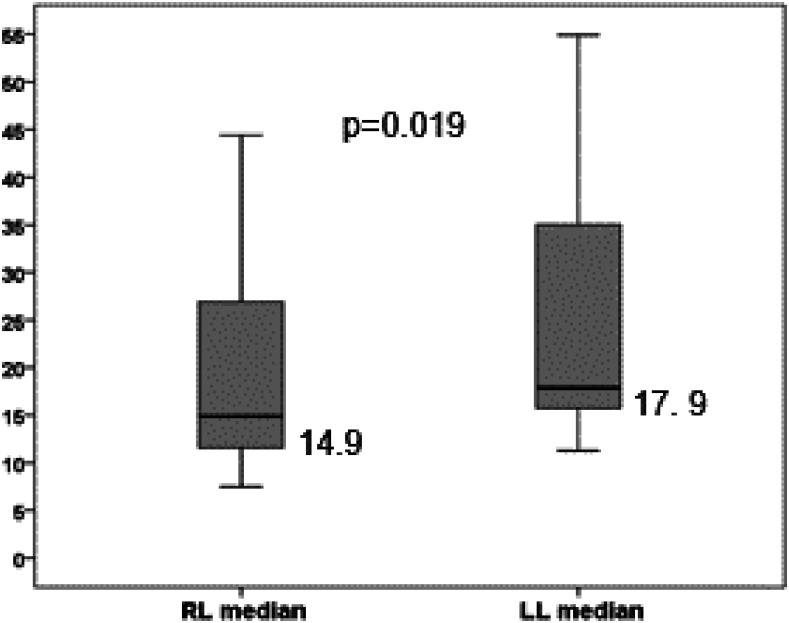
Figure 2.
Comparative analysis between median values of the right lobe (RL) and left lobe (LL). The length of the boxes represents the interquartile range where 50% of values occur. Bars shows the minimum and maximum values, median, and quartiles. The line through the middle of each box represents the median.

