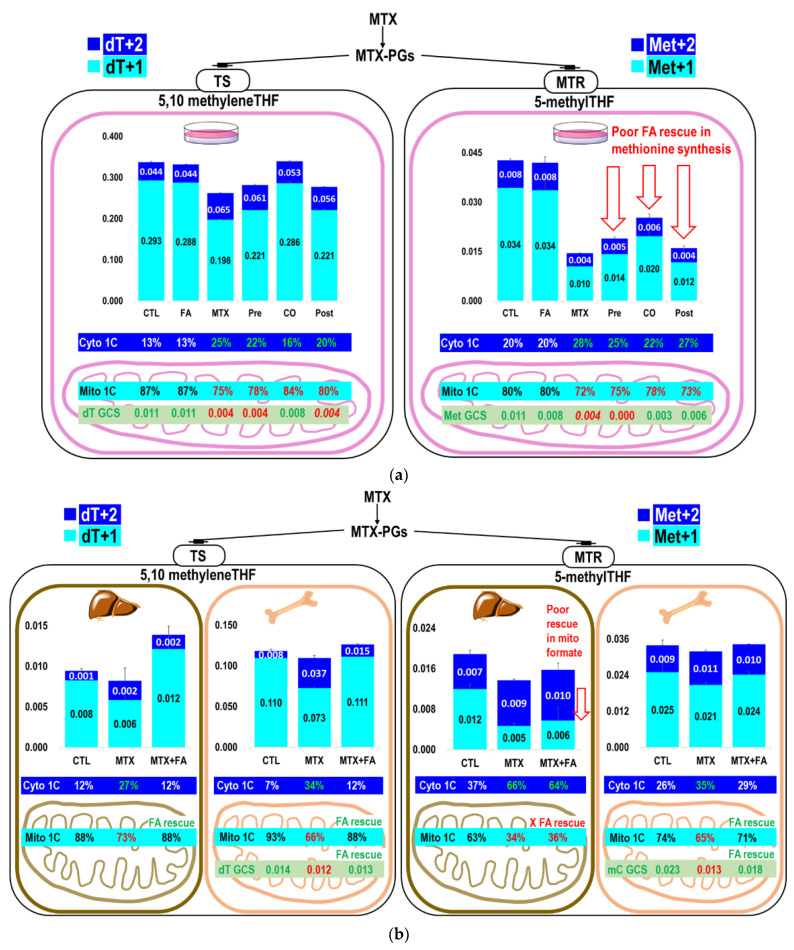
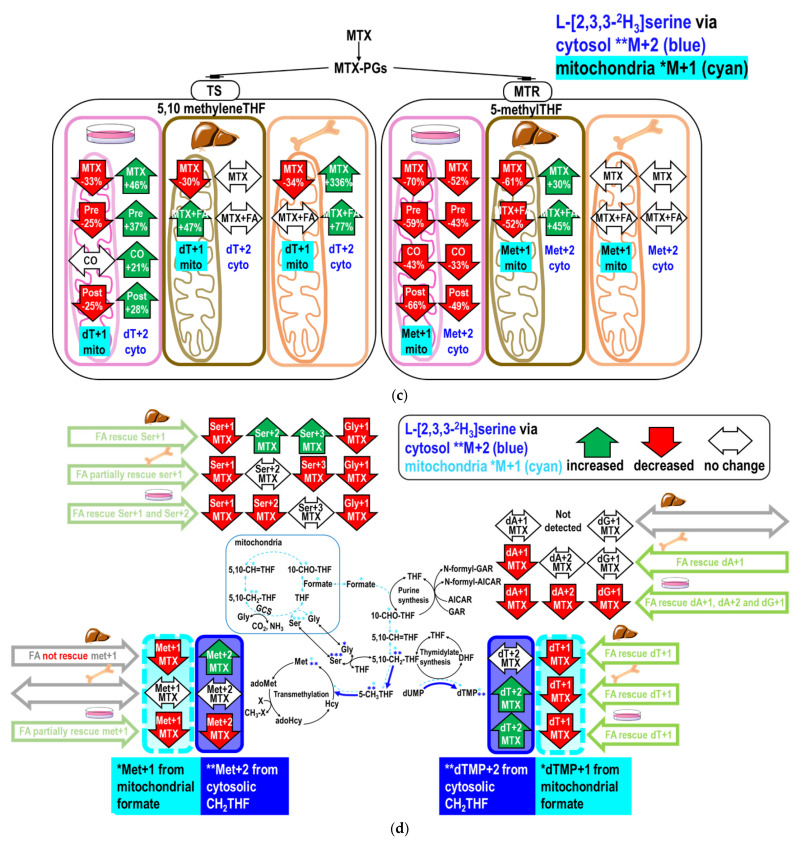
Figure 3.
Effects of MTX on the partitioning between mitochondrial and cytosolic derived formate 1-carbon metabolic fluxes in vitro and in vivo. MTX and folinate alter the partitioning of 1C metabolic fluxes between mitochondrial (cyan M+1) and cytosolic (blue M+2) derived formate in dTMP and methionine synthesis in the (a) cell model and (b) mouse liver and bone marrow. Enrichment of dTMP (including dT+1 in cyan, dT+2 in blue) and methionine (including met+1 in cyan, met+2 in blue) were plotted as cumulative bar charts. Error bars represent the standard error of the mean. The proportional fluxes from mitochondria were calculated and shown in percentage (in cyan). The proportion of dTMP (dT+1) and methionine (Met+1) synthesized via mitochondrial 1C (cyan) and cytosolic 1C (blue) from L-[2,3,3-2H3]serine were calculated and shown in the lower panel of the Figure 3a,b. Enrichments in dTMP (dT), methionine (Met), and deoxymethylcytosine (mC) derived from [2-13C]glycine, reflecting the utilization of GCS-derived formate, are shown in green. (c) The percent changes of the isotopic enrichments in each target compound compared to the control cells/animals received PBS. (d) Summary of the impacts of MTX with or without accompanied folinate treatment on nucleotide and methionine syntheses between mitochondrial and cytosolic derived formate in vitro and in vivo. * denote the labeled metabolite from the designated tracer. Bold arrows represent increased metabolic fluxes; dashed arrows represent decreased metabolic fluxes after MTX treatment.


