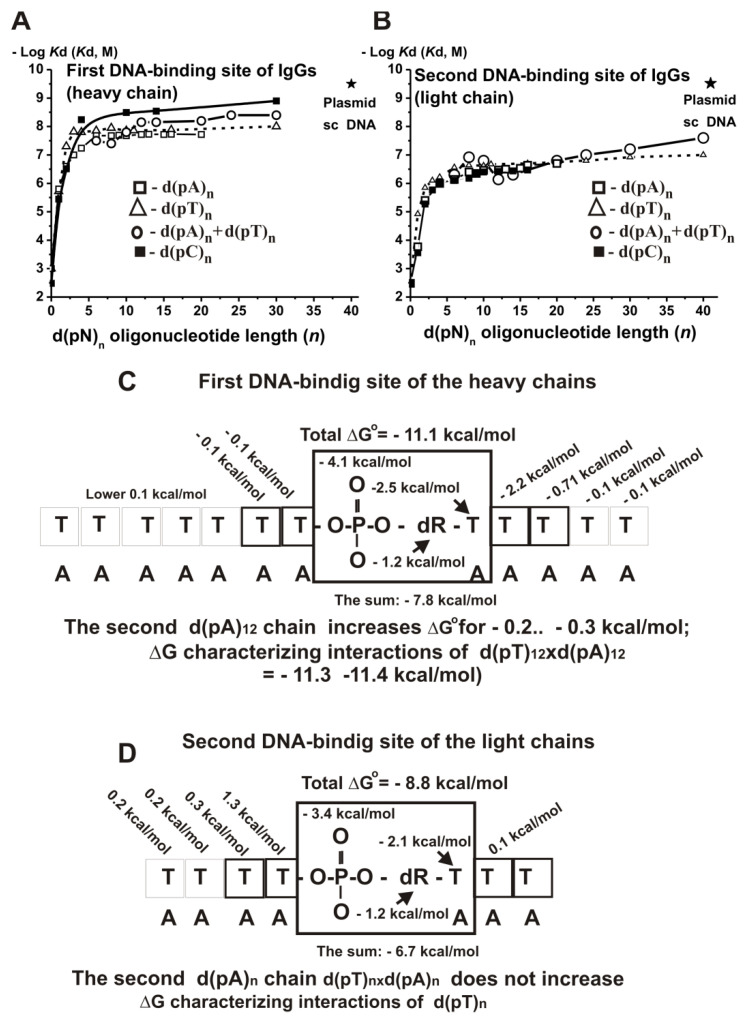
Figure 20.
The −Log dependences of Kd values for d(pN)n corresponding to the first (A) and second (B) sites of anti-DNA IgGs upon ODNs length [137]. Different ss and ds ODNs are shown on the Panels (A,B). The average error in the complex formation from two independent experiments did not exceed 7–10%. Thermodynamic models of d(pT)n interaction with the heavy (C) and light (D) chains of IgGs. Values ∆G° are given on the Panels (C,D).

