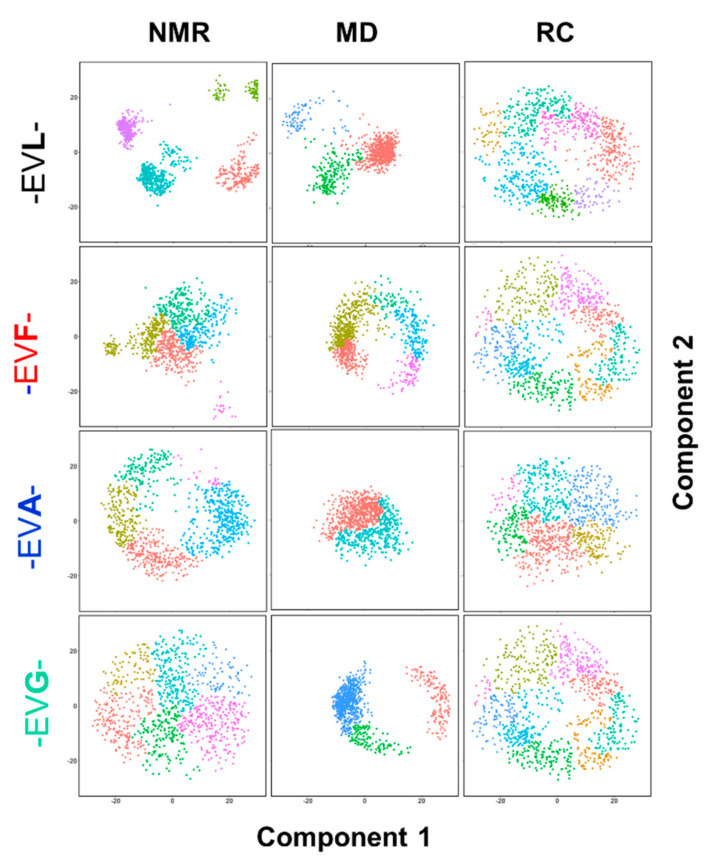
Figure 5.
Principal component analysis (PCA) of the ensembles. The plots show the comparison between the PCA of the ensemble of structures (1000 structures each). Each row corresponds to a peptide: -EVL- (top row), -EVF- (second from top row), -EVA- (second from bottom row), and -EVG- (bottom row), the ensemble of conformations estimated by NMR (left column), MD (central column) and random coil (RC, right column) are shown. Components 1 and 2 are plotted across the same scale in both dimensions (−20% to 20%).

