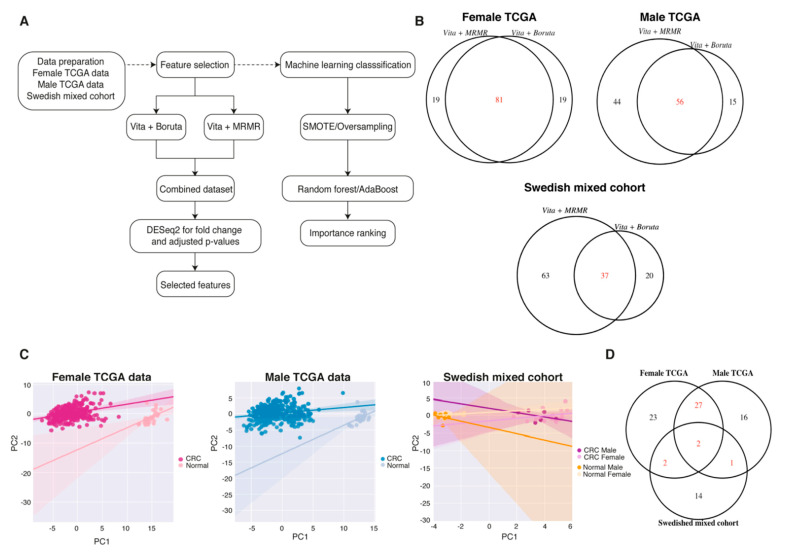
Figure 3.
Half of the biomarkers obtained with feature selection were sex-specific. (A) The data-analysis pipeline for feature selection and machine learning to find the top-ranked biomarkers. (B) Venn diagram showing the common features selected with Vita + Boruta and Vita + MRMR. (C) Principal component analysis showing the separation between normal and CRC in the different datasets. (D) Venn diagram showing the common features between the different datasets.

