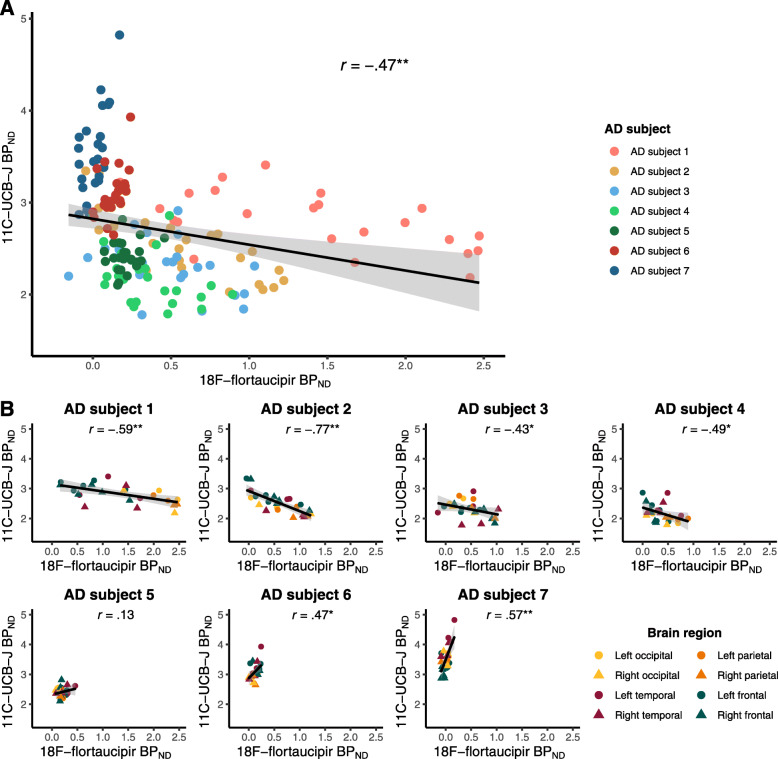
Fig. 2.
Across-subject correlations (a) and within-subject correlations (b) between regional [18F]flortaucipir BPND (x-axis) and [11C]UCB-J BPND (y-axis). [18F]flortaucipir BPND was partial volume corrected. a Colours represent different AD subjects; multiple ROIs per AD subject are shown. The black line represents the correlation line across all subjects and ROIs. b Colours represent cortical ROIs from the temporal, parietal, frontal and occipital brain lobes with triangles representing right-hemisphere regions and circles representing left-hemisphere regions. *p < 0.05; **p < 0.01

