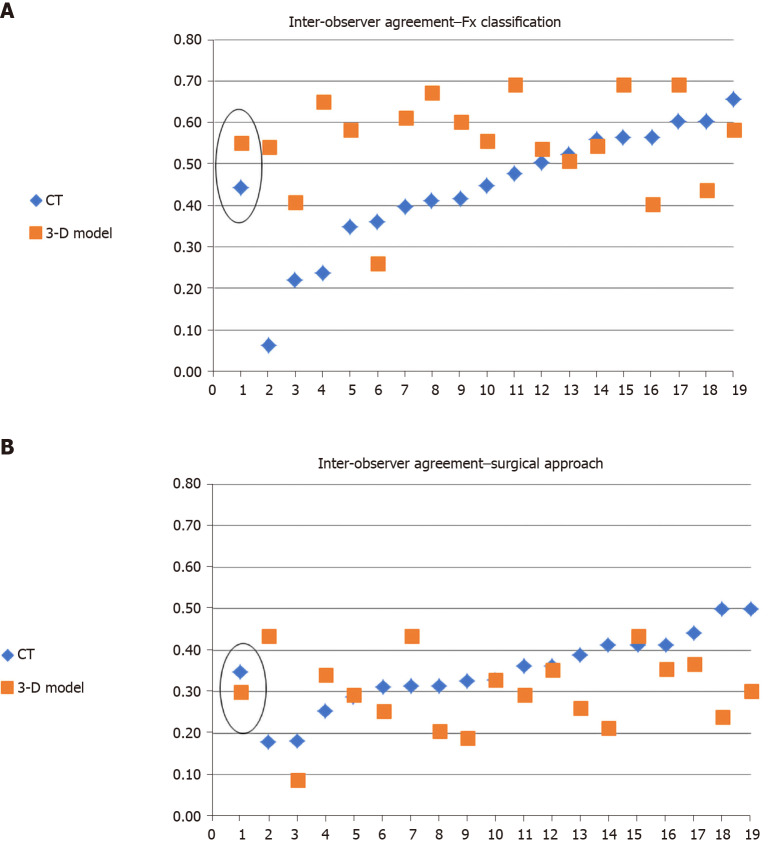
Figure 4.
Mean Kappa rate describing agreement between reviewers regarding the fracture classification and preferred surgical approach using computed tomography and 3-dimensional printed models (mean kappa in circle). A: The fracture classification; B: The preferred surgical approach. CT: Computed tomography; 3-D: Three-dimensional; Fx: Fracture.

