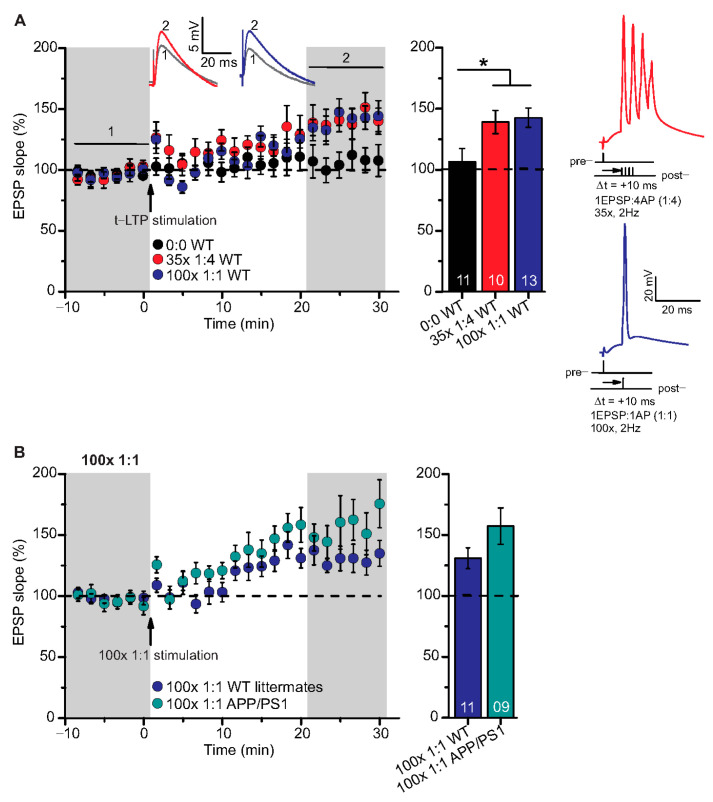
Figure 3.
High repeat STDP stimulation paradigm induced t-LTP in adult wild type and APP/PS1 mice. Whole cell patch clamp recordings of t-LTP as described in Figure 2. Left: mean time course for EPSP slopes with either of the two different STDP paradigms (indicated by arrows). Right: Averaged changes in EPSP slopes 21–30 min following t-LTP induction normalized to control before t-LTP induction. (A) Insets: average EPSP before (1) and after t-LTP induction (2). 35× 1:4 (red circles, n = 10/N = 10; p = 0.04) and 100× 1:1 stimulation (blue circles, n = 13/N = 12; p = 0.02) induced significant t-LTP in WT mice in comparison to unpaired control (0:0; black circles, n = 11/N = 7). Insets: 35× 1:4 (red color) and 100× 1:1 (blue color) STDP paradigms at 2 Hz. (B) 100× 1:1 stimulation induced comparable t-LTP in APP/PS1 mice (cyan circles, n = 9/N = 5; p = 0.126) and WT littermates (blue circles, n = 11/N = 5). Scale bars are shown in the respective insets. Data shown as mean ± SEM. Digits in the bars indicate the number of recorded neurons per condition. *: p < 0.05, multiple comparisons were performed with ANOVA followed by post hoc Dunnett’s test (A) and parametric data were compared with two-tailed Student’s t-test (B).

