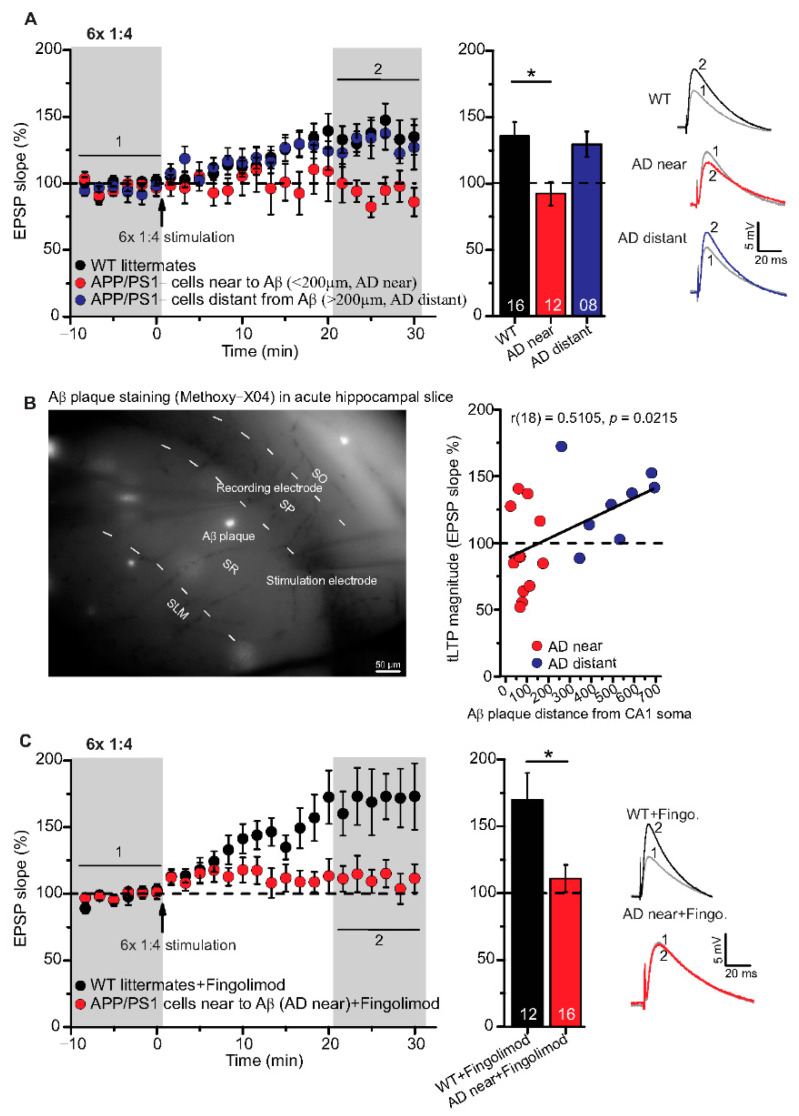
Figure 4.
Impairment of t-LTP in adult APP/PS1 mice depends on proximity of recorded CA1 neuron to Aβ plaques. Whole cell patch clamp recording of t-LTP in acute hippocampal slices as described in Figure 2. Left: Mean time-course of EPSP slopes for 6× 1:4 paradigm (indicated by arrow). Right: Averaged change in EPSP slopes 21–30 min following t-LTP induction normalized to control before t-LTP induction. (A) APP/PS1 mice showed impaired t-LTP in CA1 neurons near to Aβ plaques (<200 µm, AD near, red circles, n = 12/N = 9; vs. WT: p = 0.009), while in CA1 neurons distant from Aβ plaques (>200 µm, AD distant, blue circles, n = 8/N = 4; vs WT: p = 0.92), t-LTP magnitude was comparable to WT littermate mice (black circles, n = 16/N = 9). (B) Methoxy-X04 staining of Aβ plaques in acute hippocampal slices. APP/PS1 mice showed moderate positive correlation between CA1 cell soma distance from Aβ plaque and t-LTP magnitude (Pearson correlation coefficient r(18) = 0.5105; p = 0.02). (C) No rescue of impaired t-LTP in APP/PS1 mouse CA1 neurons near to plaques after chronic fingolimod (FTY720) treatment (red circles, n = 16/N = 7; p = 0.01), compared to fingolimod treated WT littermates (black circles, n = 12/N = 7). Data are shown as mean ± SEM. Insets: average EPSP before (1) and after t-LTP induction (2). Digits in the bars indicate the number of recorded neurons per condition. *: p < 0.05, multiple comparisons were performed with ANOVA followed by post hoc Tukey’s test (A), while non-parametric data were compared with Mann–Whitney U-test (C). Aβ: amyloid-beta, SO: stratum (S) oriens, SP: S. pyramidale, SR: S. radiatum, SLM: S. lacunosum moleculare.

