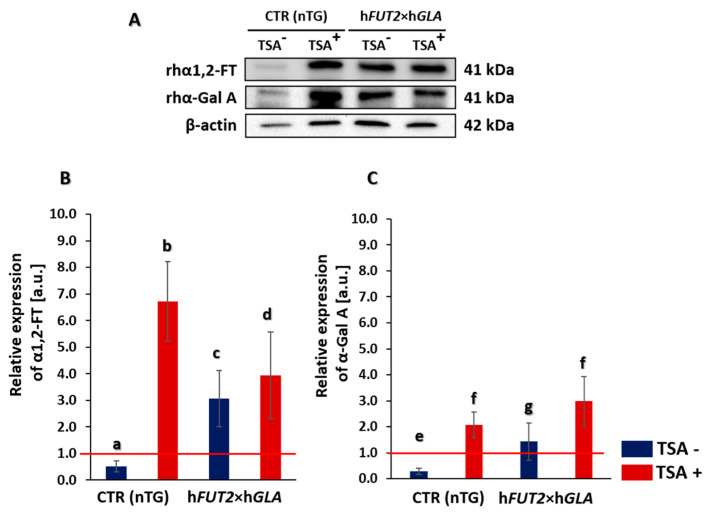
Figure 1.
Western blot analysis of the relative expression of human α1,2-fucosyltransferase (α1,2-FT) and α-galactosidase A (α-Gal A) proteins in porcine bi-transgenic and non-transgenic adult cutaneous fibroblast cells (ACFCs) undergoing or not undergoing treatment with trichostatin A (TSA+ and TSA−, respectively). Representative blots of the expression of α1,2-FT and α-Gal A proteins in the ACFC samples derived from epigenetically modulated (TSA+) and non-modulated (TSA−) cells. The samples of non-transgenic animals served as a control group (CTR nTG—panel (A)). β-Actin served as a loading control for all analyzed samples. The results of relative expression (in arbitrary units) of α1,2-FT and α-Gal A are shown in panels (B,C), respectively. Relative optical density (ROD) from three separate analyses of at least three animals for each variant is expressed as mean. Bar graphs show mean ± standard error of the mean (SEM). The red line is taken as the cut-off value 1.0. Statistics: One-way ANOVA and Tukey’s honestly significant difference (HSD) post hoc test. The bars marked with different letters differ significantly; values denoted as a-b, a-d, b-c, b-d, e-f: p < 0.01; a-c, c-d, e-g, f-g: p < 0.05.

