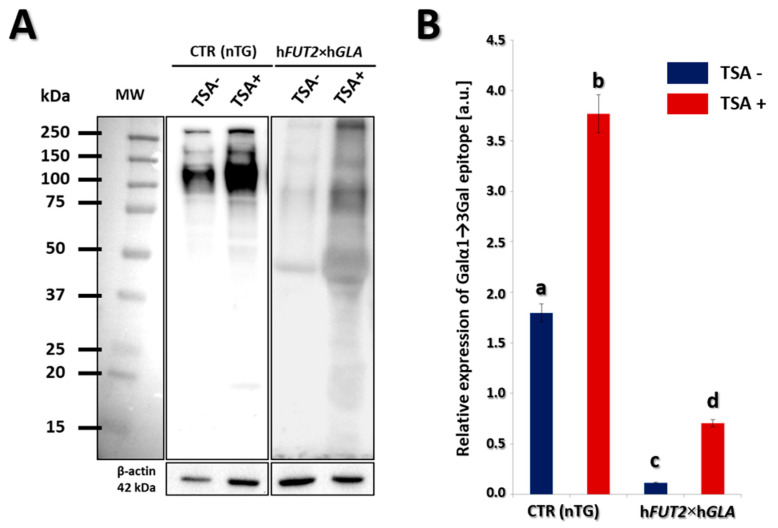
Figure 4.
Lectin blotting analysis of Galα1→3Gal epitope expression at the protein level in the in vitro cultured porcine transgenic and non-transgenic ACFCs treated (TSA+) and not treated with trichostatin A (TSA−). (A) Representative lectin blots of the expression of Galα1→3Gal epitope in TSA− and TSA+ in vitro-cultured ACFCs derived from non-transgenic (CTR nTG) control and double-transgenic (hFUT2×hGLA) pigs. MW indicates the molecular weight of protein standards (Precision Plus Protein Dual Color Standards, Bio-Rad). Each band represents a glycosylated protein containing the Galα1→3Gal epitope. β-Actin served as a loading control for all analyzed samples. (B) The semi-quantitative analysis of Galα1→3Gal epitope relative expression (in arbitrary units). Relative optical density (ROD) from three separate analyses of at least three animals for each variant is expressed as mean. Graph bar shows mean ± SEM. Statistics: One-way ANOVA and Tukey’s HSD post hoc test. The bars marked with different letters differ significantly. Values denoted as a-b, a-c, a-d, b-c, b-d: p < 0.01; c-d: p < 0.05. The relative expression of Galα1→3Gal epitope was significantly lower in the ACFCs stemming from hFUT2×hGLA bi-transgenic pigs as compared to the control (CTR nTG) non-transgenic animals. It is also noteworthy to highlight the fact that the TSA− cell samples derived from hFUT2×hGLA double-transgenic pigs were characterized by the remarkably lowest expression of Galα1→3Gal epitopes. However, expression of Galα1→3Gal epitopes was significantly higher in TSA+ cell samples compared to that identified for their TSA− counterparts derived from both transgenic and non-transgenic pigs.

