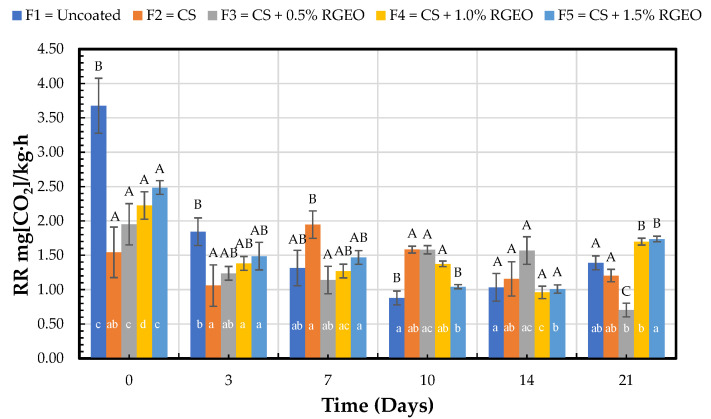
Figure 5.
CO2 respiration rate in pears with CS + RGEO treatments: F1 = control, F2 = CS, F3 = CS + RGEO 0.5%, F4 = CS + RGEO 1.0%, and F5 = CS + RGEO 1.5%. According to the ANOVA test, mean values and intervals of Duncan test for treatments and Fisher for days with 95%. Different lowercase letters (a, b, c) indicate significant differences between days according to the LSD Fisher test for each treatment in a confidence interval of 95%. In contrast, different uppercase letters (A, B, C) indicate significant differences between treatments for each day according to the Duncan test in a confidence interval of 95%.

