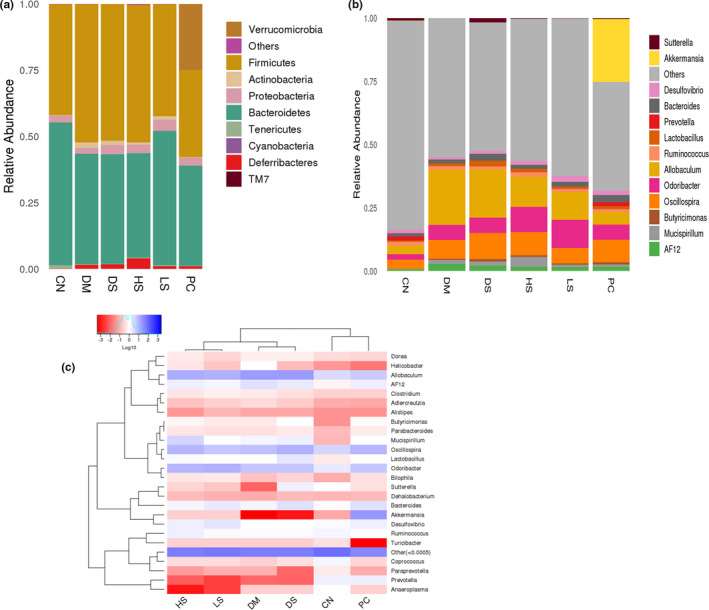
Figure 7.

Effect of different dosages of SFN on intestinal flora in type II diabetes. (a) The composition and relative abundance of bacterial communities at the phylum level. (b) Heatmap analysis of the microbiota changes with different dietary interventions at the genus level. Value is the mean ± SEM (n = 4)
