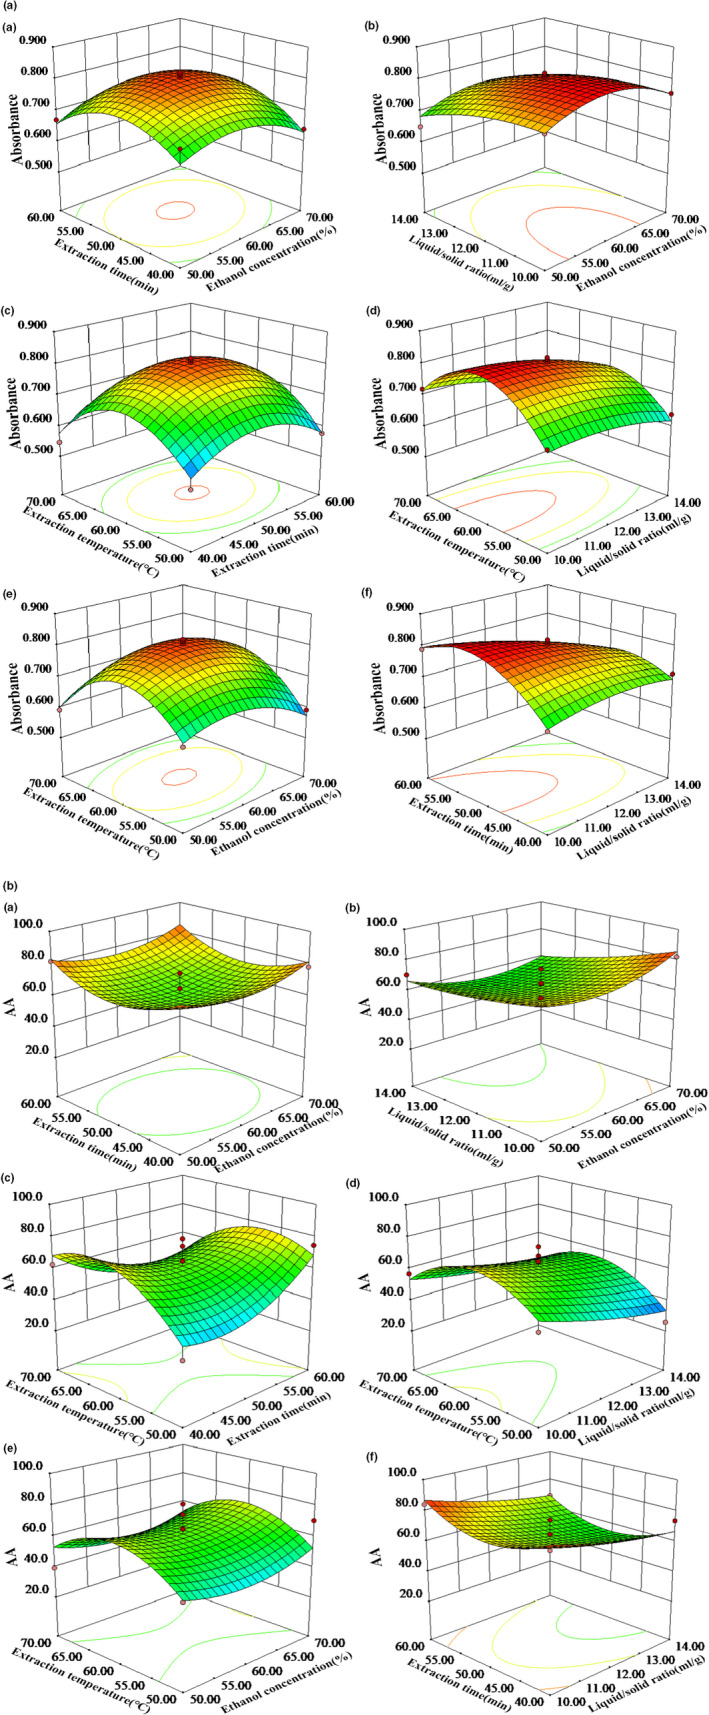
FIGURE 2.

The three‐dimensional plot showing the correlative effects of extraction time and ethanol concentration (a), extraction liquid/solid ratio and ethanol concentration (b), extraction temperature and time (c), extraction temperature and liquid/solid ratio (d), extraction temperature and ethanol concentration (e) and extraction time and liquid/solid ratio (f) on the value of absorbance of GYP (part A) and the AA of GYP (part B)
