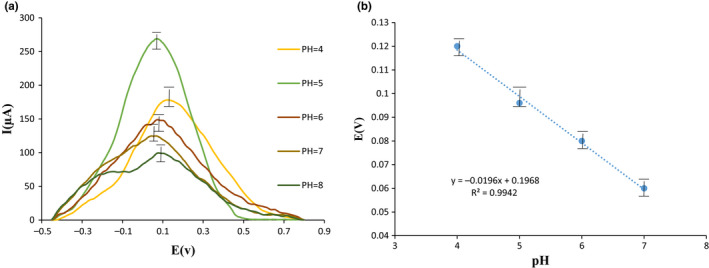
FIGURE 5.

(a) Square wave voltammogram of 30 μM T2 toxin on the surface of the G/PAN nanofiber modified electrode at pH 3–12, Britton–Robinson (B‐R) buffer solution (b) linear graph of pH change of 30 μM T2 toxin on the surface of the G/PAN nanofiber modified electrode
