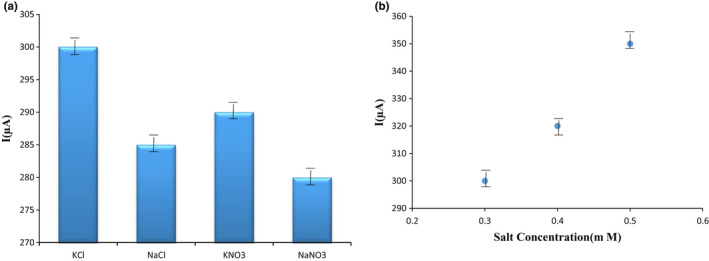
FIGURE 6.

(a) The impact of different salt concentrations with 30 μM T2 toxin on the surface of the G/PAN nanofiber modified electrode to determine the effective salt concentration in electron transfer, (b) the effect of different concentrations of KNO3 with 30 μM T2 toxin on the surface of the G/PAN nanofiber modified electrode to recognize the effective salt concentration in electron transfer as a supporter electrolyte
