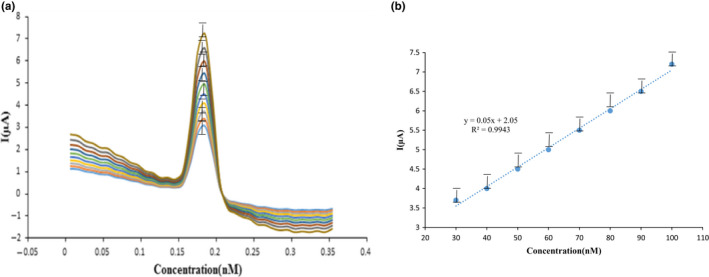
FIGURE 7.

(a) Differential pulse voltammetry (DPV) techniques of the electrochemical behavior of T2 toxin over the concentration range 30–100 nM at the presence of B‐R buffer with pH = 5, (b) linear chart of the effect of different concentrations on the transition flow with compressibility coefficient = 0.99
