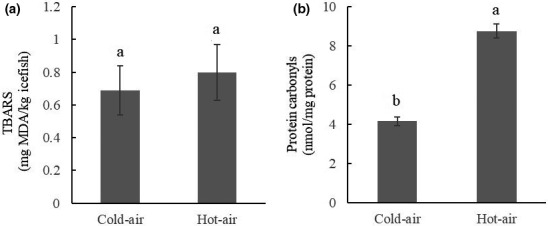
Figure 5.

Oxidation indexes of dried icefish in different drying processes. (a) TBARS value. (b) Protein carbonyl content. Note: Standard error bars are indicated, and different letters on the bars represent significant differences (p < .05) in each treatment (n = 10)
