
FIGURE 2.
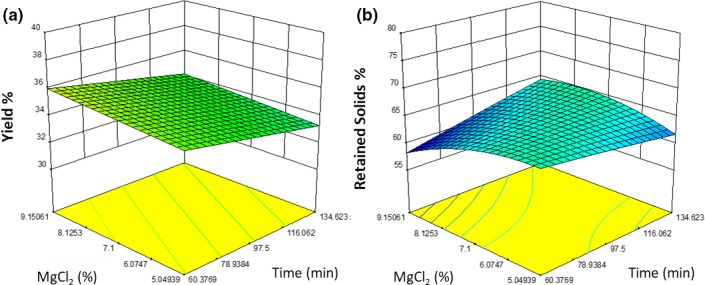
A graphical representation of the effect of percent MgCl2 (w/w) (y‐axis) and time (x‐axis) at 2.14% (w/w) oil addition with on (a) percent yield and (b) percent retained solids
Official websites use .gov
A
.gov website belongs to an official
government organization in the United States.
Secure .gov websites use HTTPS
A lock (
) or https:// means you've safely
connected to the .gov website. Share sensitive
information only on official, secure websites.
A graphical representation of the effect of percent MgCl2 (w/w) (y‐axis) and time (x‐axis) at 2.14% (w/w) oil addition with on (a) percent yield and (b) percent retained solids