
FIGURE 3.
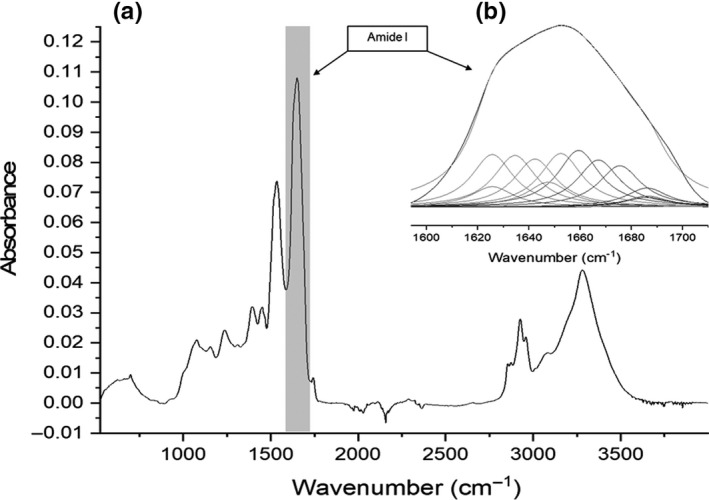
A representative ATR‐FTIR spectra of experimental pea‐based tofu, where (a) is the spectra between wave number 4,000 and 500 cm−1, with the wave number (1,720 and 1,580 cm−1) of the spectra containing the amide I region highlighted, and b) represents an expanded view, demonstrating the deconvolution of the amide I region