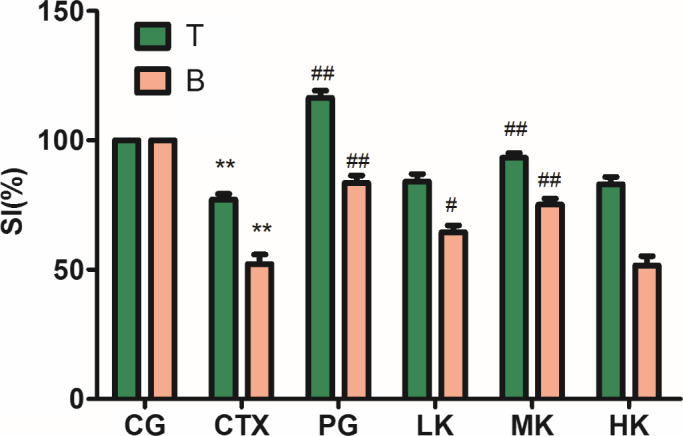
Figure 1.

KGM demonstrated significant influences on splenic lymphocyte proliferation including T and B cells induced by Con A or LPS. Values are expressed as means ± SD, n = 8. *p < .05, **p < .01, *compared with control group; # p < .05; ## p < .01, Compared with CTX group. CG, control group; CTX, CTX model group; PG, positive group; LK, low KGM; MK, middle KGM; HK, high KGM
