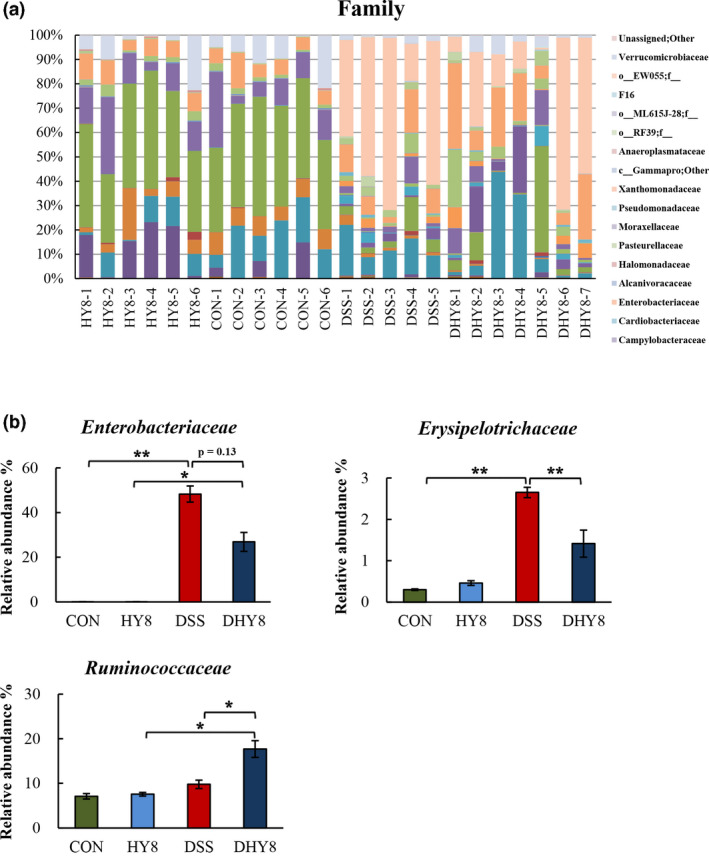
Figure 5.

A, Comparative analysis of the taxonomic composition of the microbial community at the family level. (f_ means unassigned bacteria). B, The relative abundance of IBD marker and the inflammation‐related bacteria, Enterobacteriaceae and Erysipelotrichaceae members, and the SCFA‐related bacteria, Ruminococcaceae members, at the family level. All values are presented as mean ± SE (n = 5–7) by the two‐way ANOVA and Tukey's test; *p < 0.05 and **p < 0.01
