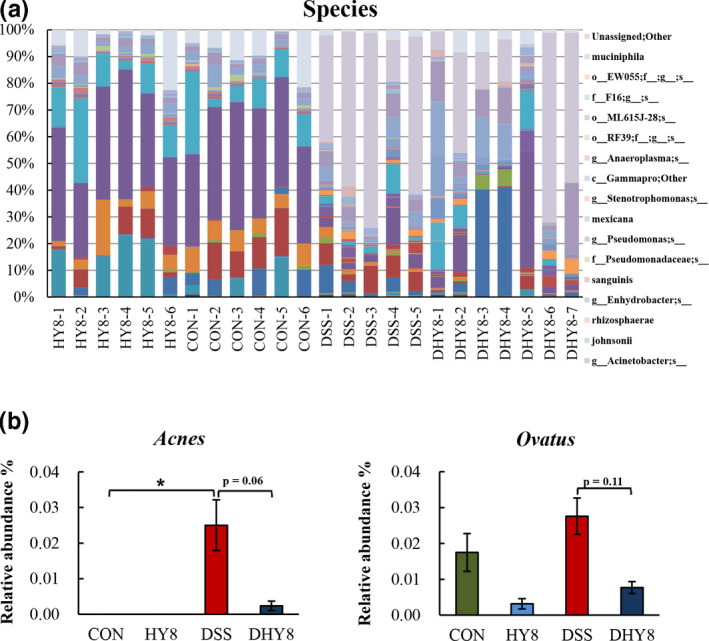
Figure 7.

A, Comparative analyses of the taxonomic composition of the microbial community at the species level. (f_, g_, and s_ mean unassigned bacteria). B, The relative abundance of the bacteria at the species level: immune system and inflammation‐related bacteria, P. acnes, and the antibody response‐related bacteria, Bacteroides ovatus. All values are presented as mean ± SE (n = 5–7) by the two‐way ANOVA and Tukey's test; *p < 0.05 and **p < 0.01
