Fig. 3.
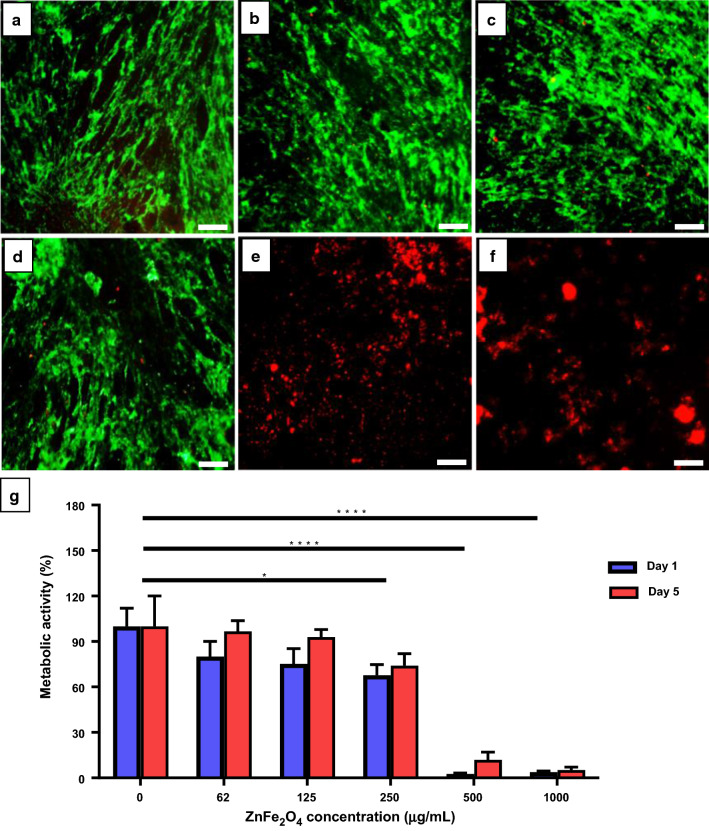
In vitro biocompatibility assay. Representative fluorescence microscopy images of human dermal fibroblast cells (HDF) stained with ethidium homodimer-1 (red color; dead cells) and calcein-AM (green color; live cells) after 5 days incubation with ZnFe2O4 NPs at concentrations of a 0 µg/mL (control), b 62 µg/mL, c 125 µg/mL, d 250 µg/mL, e 500 µg/mL, and f 1000 µg/mL. Scale bars show 500 µm. g The percent (%) metabolic activity of HDF cells on day 1 and 5 after subjecting to different concentrations of ZnFe2O4 NPs. Error bars denote the standard deviations of 4 replicates, and * represents the significance of the reduction in % metabolic activities of treated cells as compared to control. The data were analyzed by two-way ANOVA, and *p ≤ 0.05, ****p ≤ 0.001 were considered statistically significant

