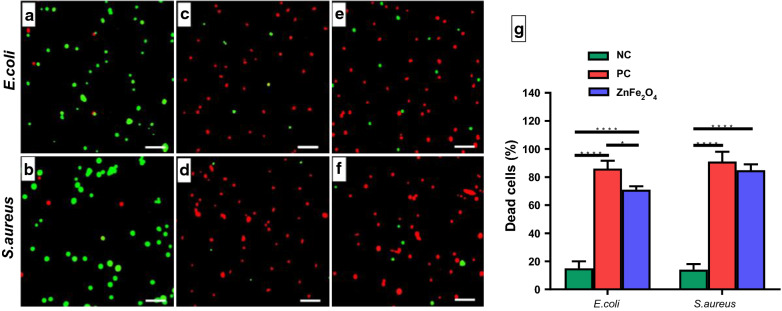
Fig. 6.
Bacterial live/dead assay. Fluorescence micrographs of E. coli and S. aureus after treatment with 100 µg/mL of ZnFe2O4 NPs. a Negative control E. coli cells without any treatment. b S. aureus negative control without treatment. c E. coli treated with tetracycline (positive control). d S. aureus treated with tetracycline (positive control). e E. coli treated with ZnFe2O4 NPs (100 µg/mL). f S. aureus treated with ZnFe2O4 NPs (100 µg/mL). g Percent (%) dead cells of E. coli and S. aureus after ZnFe2O4 NPs treatment as compared to the negative control (NC) and positive control (PC). Experiments were performed in triplicate. The percent dead cells of E. coli and S. aureus were significantly higher in nanoparticle-treated groups and positive control as compared to the negative control. *p ≤ 0.05 and ****p ≤ 0.0001 are statistically significant. Scale bars show 200 µm

