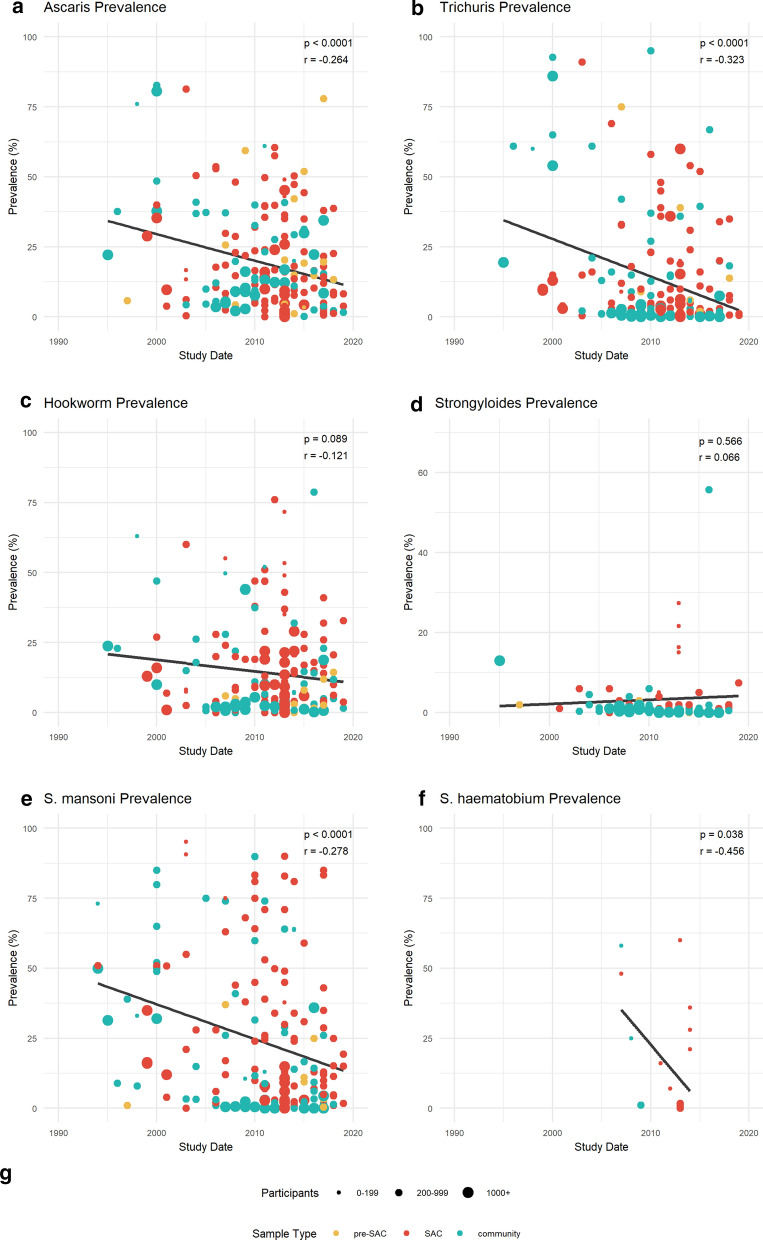
Fig. 2.
Change in prevalence of STH and SCH between 1994 and 2019. Prevalence of Ascaris lumbricoides (AL; a), Trichuris trichiura (TT; b), hookworm (HW; c), Strongyloides stercoralis (SS; d), Schistosoma mansoni (SM; e), and Schistosoma haematobium (SH; f) infections between 1994 and 2019. Pearson’s correlation coefficient (r; top right corner of each plot with associated p-value) was used to measure the linear correlation between parasite prevalence and study date. Study populations, differentiating between pre-school-aged children (pre-SAC), SAC and community-wide study populations, are indicated by different colours, whilst point size indicates study population size (see legend) (g). The trend line was not weighted by sample size. Note the SS graph y-axis range is from 0 to 70, and differs from that of the other plots. For other abbreviations, see Fig. 1

