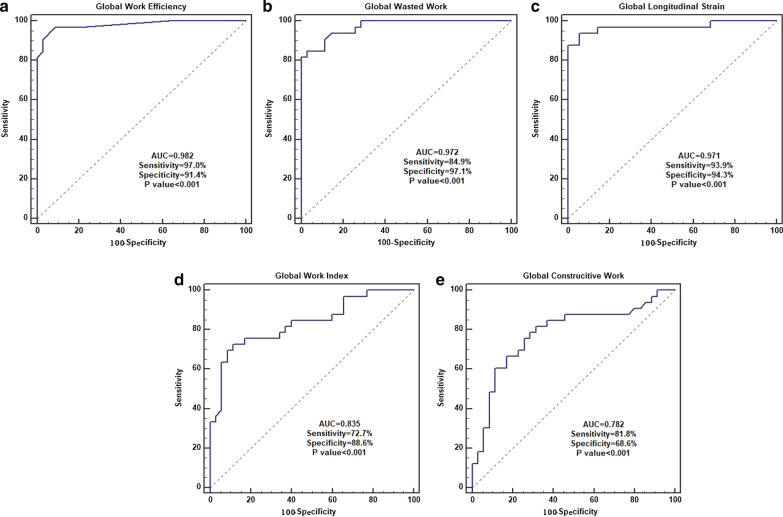
Fig. 3.
ROC curve analysis to evaluate the sensitivity and specificity of GWE (a), GWW (b), GLS (c), GWI (d) and GCW (e) for identifying LV dysfunction in MHD with LVH patients. The area under the ROC curve values for the GWE, GWW, GLS, GWI, and GCW were 0.982, 0.972, 0.971, 0.835, and 0.782, respectively. The sensitivity for the GWE, GWW, GLS, GWI, and GCW were 97.0%, 84.9%, 93.9%, 72.7%, and 81.8%, respectively. The specificity for the GWE, GWW, GLS, GWI, and GCW were 91.4%, 97.1%, 94.3%, 88.6%, and 68.6%, respectively. The cutoff values for the GWE, GWW, GLS, GWI, and GCW were 94%, 123 mmHg%, -18.44%, 1909 mmHg%, and 2157 mmHg%, respectively

