Fig. 2.
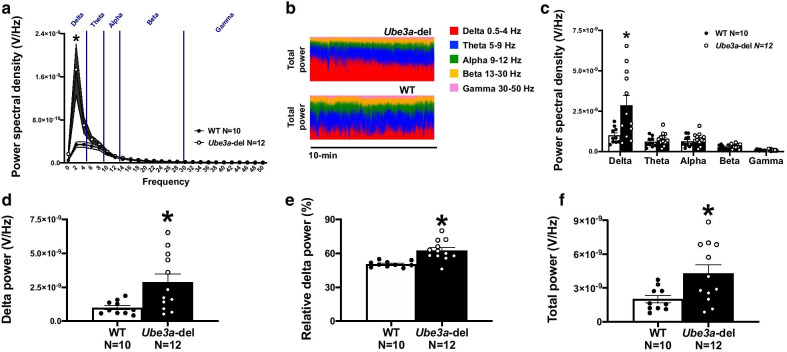
Ube3a-del mice exhibited elevated delta power. Surface EEG was collected in mice via a wireless telemetric device and analyzed for spectral power dissimilarities in delta (0.5–4 Hz), theta (5–9 Hz), alpha (9–12 Hz), beta (13–30 Hz) and gamma (30–50 Hz) frequencies during baseline EEG recordings. a, c Power spectral density collected from Ube3a-del mice differed from WT, specifically in the delta frequency range where Ube3a-del mice had higher delta power. No significant differences were detected at theta, alpha, beta or gamma frequencies by genotype. b Representative 10-min power distributions of Ube3a-del and WT mice illustrated the elevated delta phenotype observed in deletion animals. Power spectral analysis was also evaluated by total delta power (summation of power spectral densities across the delta frequency per animal), relative delta power (total delta power of a given animal divided by that animal’s total power) and total power (summation of power spectral densities across all frequencies per animal) between genotype. Quantification of d delta power and e relative delta power was significantly increased in Ube3a-del mice compared to WT littermate controls. c Total power was also significantly higher in Ube3a-del animals due to their elevated delta power. *p < 0.05, Two-way RM ANOVA comparing genotypes across frequency and Student’s t test between genotype

