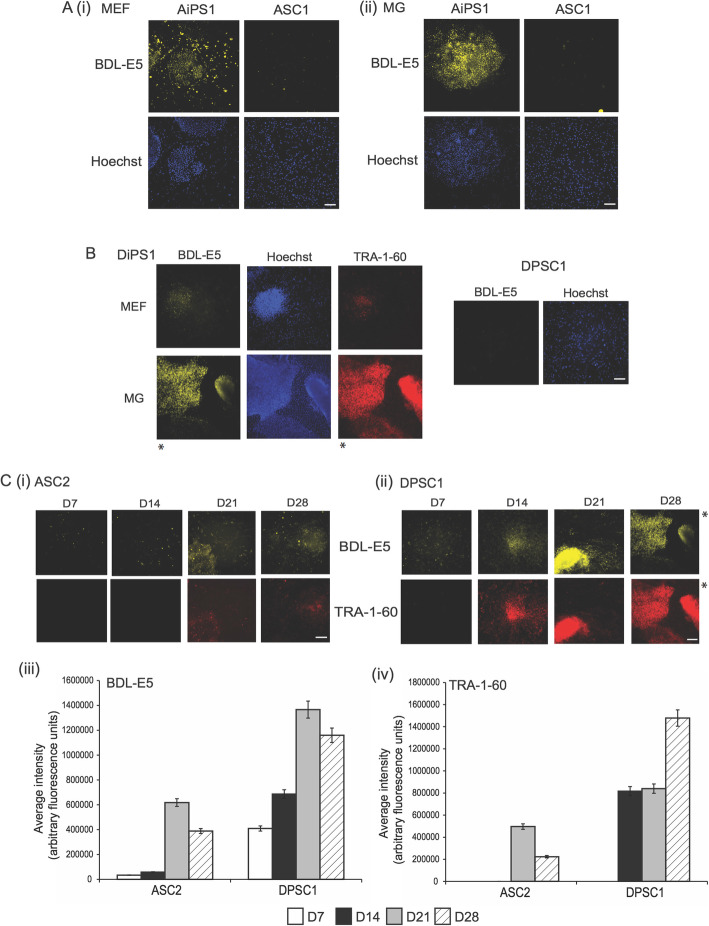
Fig. 2.
a Fluorescent images (10X objective) of BDL-E5 probe (no wash) and Hoechst 33342 staining of AiPS1 colonies and its original ASC1 (ASC line #1) on MEF- (i) and MG-coated (ii) plates from primary screening (n = 3). b Fluorescent images (10X) of BDL-E5 probe (no wash), Hoechst, and TRA-1-60 on DiPS1 colonies and DPSC1 (DPSC line #1) on MEF- and MG-coated plates from secondary screening (n = 3). c Fluorescent images (10X) and average fluorescence intensity of BDL-E5 probe (no wash) and TRA-1-60 on ASC2 (i), (iii), and DPSC1 (ii), (iv) on MG-coated plates at 7, 14, 21, and 28 days post nucleofection (dpn) with reprogramming factors. *Represents the same images. Cells were incubated with 500 nM of BDL-E5 in appropriate media for 1 h (n = 3). Scale bar represents 100 μm

