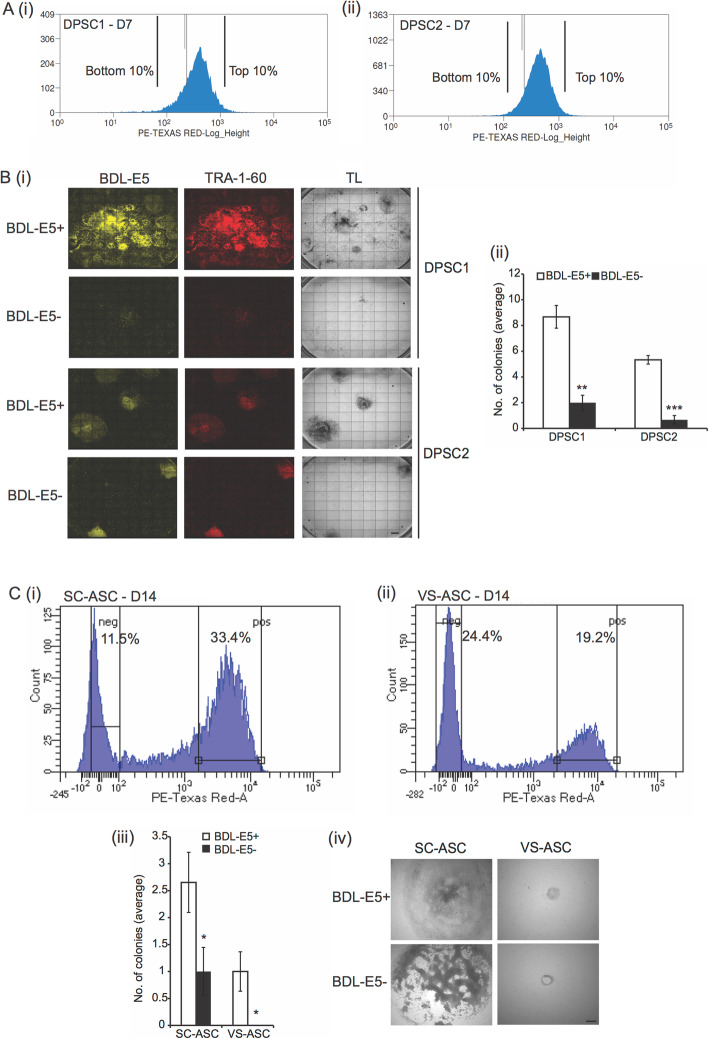
Fig. 4.
a Histogram (FACS) showing BDL-E5+ cell populations at 7 dpn: DPSC1 (i) and DPSC2 (ii). Relative cell count is indicated on the y-axis, and fluorescence intensity (Texas Red channel) on the x-axis. The top 10% and bottom 10% of cell populations are as indicated (n = 3). b (i) Fluorescent images of BDL-E5, TRA-1-60, and transmitted light (TL) images (4X) showing iPS colonies derived from BDL-E5+ and BDL-E5− cell populations of DPSC1 and DPSC2 following FACS at 7 dpn. (ii) Graph showing average number of DiPS colonies in reprogrammed BDL-E5+ and BDL-E5− cell populations obtained after FACS of DPSC1 and DPSC2. **p < 0.01 and ***p < 0.001 denote statistical significance (n = 3). c Histogram showing FACS of BDL-E5+ and BDL-E5− cell populations at 14 dpn from SC-ASC S15 (i) and VS-ASC S15 (ii). The percentage of positively and negatively stained cells is shown. (iii) Graph showing average number of iPS colonies in BDL-E5+ and BDL-E5− cell populations obtained after FACS at 14 dpn from SC-ASC S15 and VS-ASC S15. *p < 0.05 denotes statistical significance. (iv) TL images (10X) showing iPS colonies from SC-ASC S15 and VS-ASC S15 following FACS for BDL-E5+ and BDL-E5− cell populations. Similar results were obtained with S16-derived SC-ASC and VS-ASC (n = 3). Scale bar represents 100 μm

