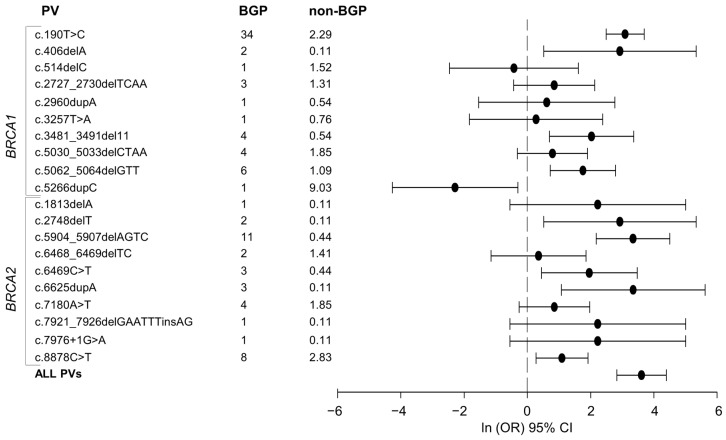
Figure 1.
Ln odds ratio (ORs) and 95% confidence intervals (CIs) of the 20 PVs found in both the 100 BGP and the 919 non-BGP carriers. For each PV, the carrier frequency (%) is reported; the ln (OR) and the 95% CI are indicated by dots and horizontal lines, respectively. The ORs were estimated by univariate logistic model. The joint OR (ln OR = 3.61 (95% CI = 2.83–4.39) obtained by considering all the 20 PVs, is also showed.

