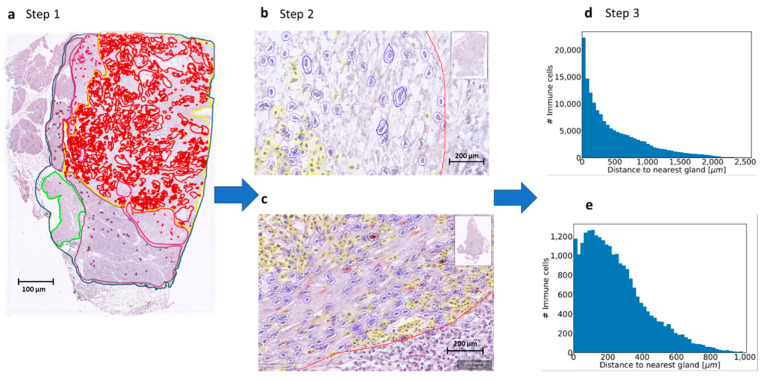
Figure 2.
Process using machine learning to determine immune cell spatiality. (a). Step 1. Defining the Region of Interest (ROI) (yellow line). Every scanned slide was annotated in: total tissue (dark blue), normal pancreas (purple), atrophic pancreas (pink), normal duodenum (green) and tumor (red). For the machine learning classifier, a Region of Interest (ROI) was also annotated (yellow). In this area, only the cell detection classifier was used to detect the stromal cells in fibroblasts and immune cells. (b,c). Step 2. The cell classifier was trained by the pathologist to recognize fibroblasts (blue annotations) and immune cells (yellow annotations). The tumor glands were all annotated manually gland by gland and are shown in red annotation. (d,e). Step 3. Measurement of distance of immune cell to tumor gland. From each slide, a plot was made with the number of immune cells (y-axis) and the distance to the nearest tumor gland (x-axis). These plots were used to measure the mean distance from the immune cell to the tumor gland in micrometers. Some slides showed immune cells at a greater distance from the tumor and some slides showed immune cells nearby the tumor. With this technique, we could identify immune cell aggregates, so groups of immune cells were located close to each other.

