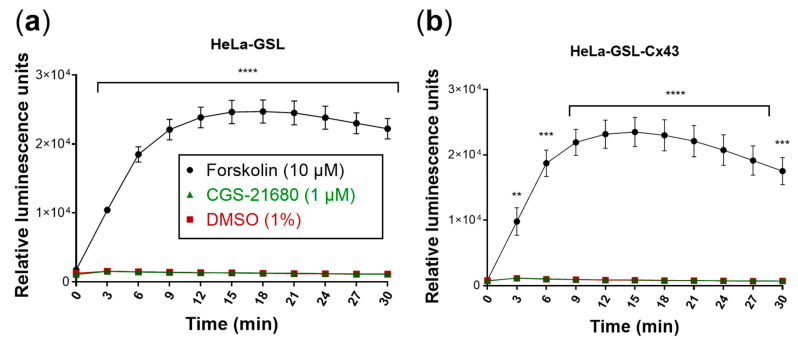
Figure 5.
Evaluation of the biosensor cells. Forskolin (10 µM) was used as a positive control and DMSO (1%) as a negative control. Means ± SEM of three individual experiments performed in duplicates are given. (a) Biosensor cells produced luminescence only in response to forskolin (10 µM). Luminescence response to CGS-21680 (1 µM) was not different from control (DMSO). (b) Cx43 transfection of biosensor (HeLa-GSL) cells did not affect luminescence responses. Statistical significance calculated with repeated measures 2-way ANOVA and Dunnet’s multiple comparisons test comparing treatments to control (DMSO, 1%). ** p < 0.01, *** p < 0.001, **** p < 0.0001.

