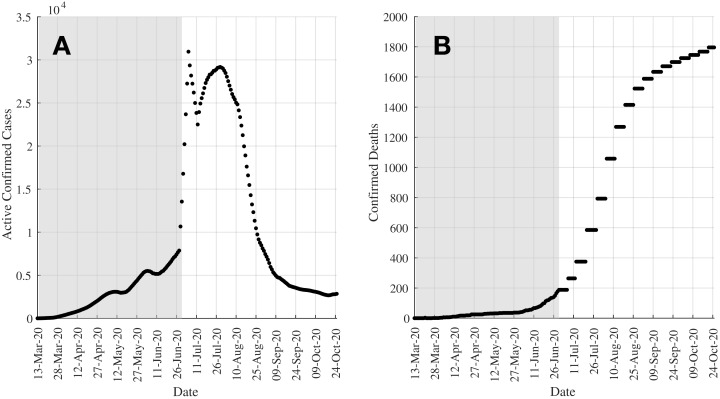
Figure 1. Plots showing the up-to-date cases in Kazakhstan as of October 25, 2020.
(A) shows the 7-day moving average of active confirmed cases whilst (B) shows the confirmed deaths. Data in both graphs are plotted since the first cases were reported on March 13, 2020. The shaded regions show the range of data (up till Day 108 (June 28, 2020)) used to understand the effectiveness of control actions in this study.

