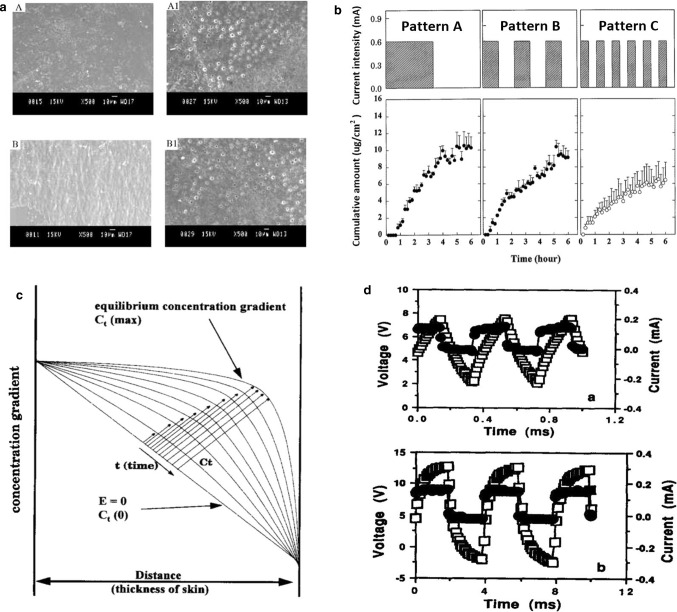
Fig. 4.
a SEM photographs of transdermal patches A: EC/PVP (3:2) before permeation studies; A1: EC/PVP (3:2) after permeation studies; B: ERL/ERS (4:1) before permeation studies; B1: ERL/ERS (4:1) after permeation studies [30]. b Comparison of transdermal iontophoretic skin permeation profiles of LHRH by three different application pattems with a current intensity of 0.6 mA [3]. c Schematic illustration of different concentration gradients across skin during various durations of current application. The transdermal iontophoretic skin permeation of LHRH is proportional to the concentration gradient, whose equilibrium concentration gradient is time-dependent [3]. d Current (filled circle) and voltage (open square) profiles 1 h after the initiation of lysine iontophoresis with 50% square-wave, unipolar, pulsed DC at frequencies of (up) 2500 Hz, (down) 250 Hz [31]

