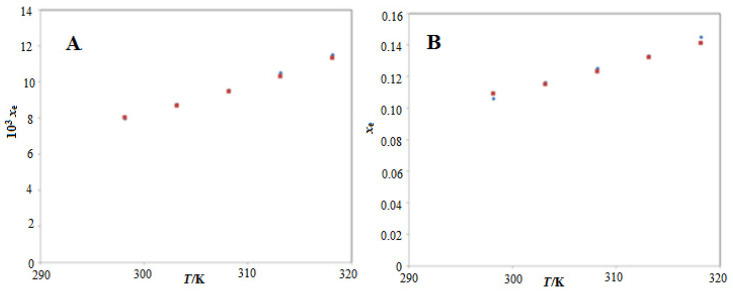
Figure 3.
Comparison of mole fraction solubility values of ECT in (A) water and (B) PEG-400 with literature values at T = 298.2 K to 318.2 K; the symbol  indicates the experimental mole fraction solubilities of ECT in (A) water and (B) PEG-400 and the symbol
  indicates the literature solubilities of ECT in (A) water and (B) PEG-400 taken from reference [16].

