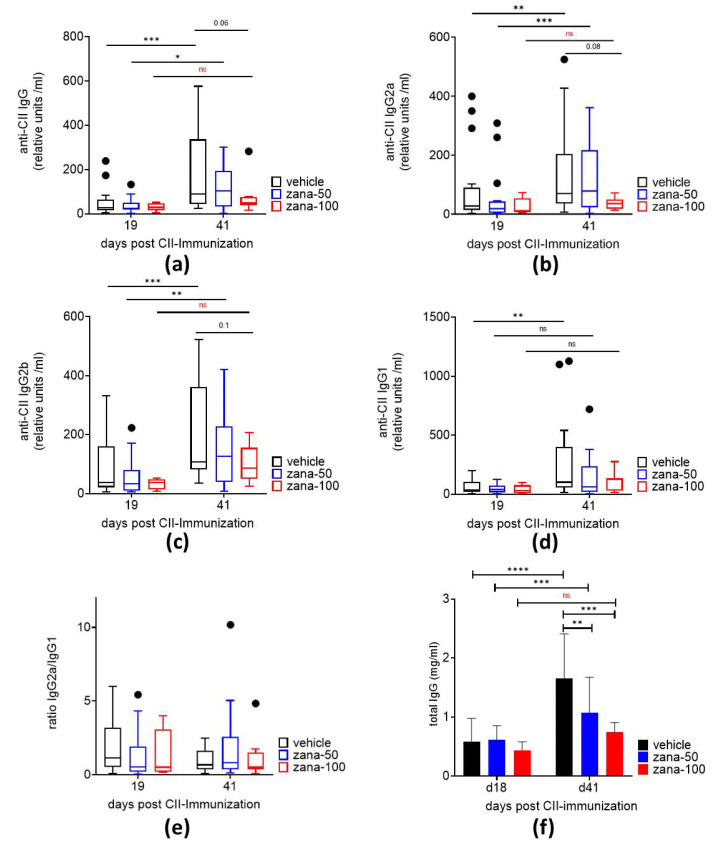
Figure 2.
High-dose zanamivir prevents the increase in anti-CII IgG and total IgG levels in the arthritic phase of CIA. Serum levels of anti-CII IgG (a), anti-CII IgG2a (b), anti-CII IgG2b (c), and anti-CII IgG1 (d) antibodies in CIA mice. (e) Anti-CII IgG2a: anti-CII IgG1 ratio. Data (a-e) are presented as Tukey’s box- and whisker plots. Observations outside the whiskers are considered outliers and presented as black dots. (f) Serum levels of total IgG. Results are shown as ± standard deviation (±SD). * p ≤ 0.05; **p ≤ 0.01; *** p ≤ 0.005; **** p ≤ 0.0001. ns = not significant. Two-way ANOVA for repeated measures with Sidak’s or Tukey’s multiple comparisons test.

