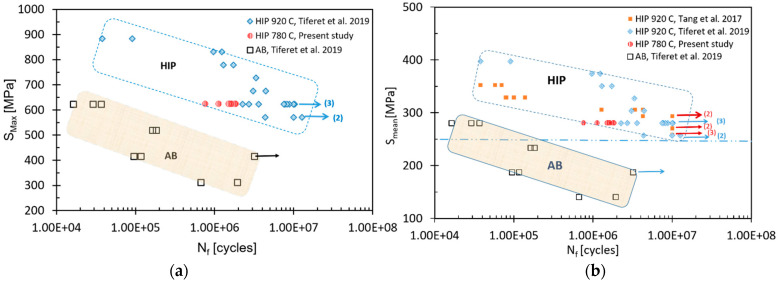
Figure 7.
Fatigue results of the present study stress vs. the number of cycles to failure, (a) maximum stress (left) and (b) mean stress (right). For comparison, the data of Tiferet et al. [4] and of Tang et al. [50], are given. Arrows indicate runouts (1 × 10⁷ cycles) and the number of specimen runouts is summed in brackets.

