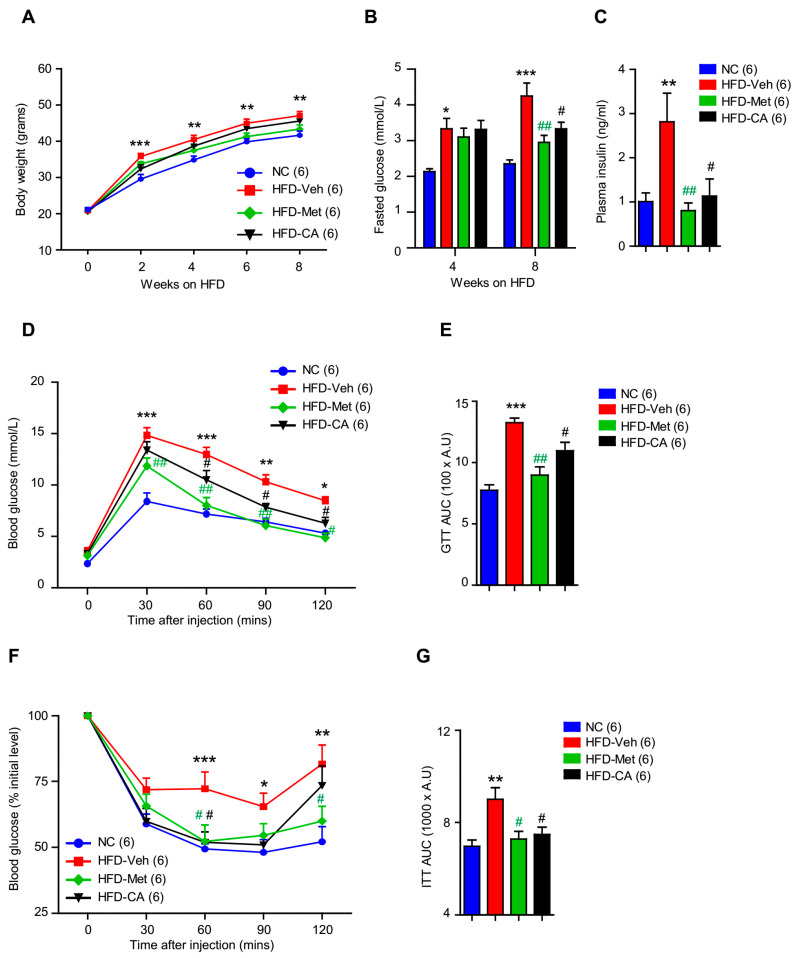
Figure 4.
CA treatment improved whole-body glucose homeostasis of mice. (A) Body weights of normal chow (NC)-fed mice and high-fat diet (HFD)-fed mice treated with vehicle (veh), metformin (met), and CA for 8 weeks. (B) Fasting blood glucose levels of NC-fed mice and HFD-fed mice treated with vehicle, metformin, and CA for 8 weeks. (C) Plasma insulin levels of NC-fed mice and HFD-fed mice treated with vehicle, metformin, and CA for 8 weeks. GTT (D) and GTT AUC (E) of NC-fed mice and HFD-fed mice treated with vehicle, metformin, and CA for 6 weeks. ITT (F) and ITT AUC (G) of NC-fed mice and HFD-fed mice treated with vehicle, metformin, and CA for 6 weeks. The results are expressed as mean ± SEM. One-way ANOVA with Tukey’s post-hoc tests in bar graphs and two-way ANOVA with Bonferroni post-hoc tests in line graphs. * p < 0.05, ** p < 0.01, *** p < 0.001 compared to NC. # p < 0.05, ## p < 0.01 compared to HFD-Veh.

