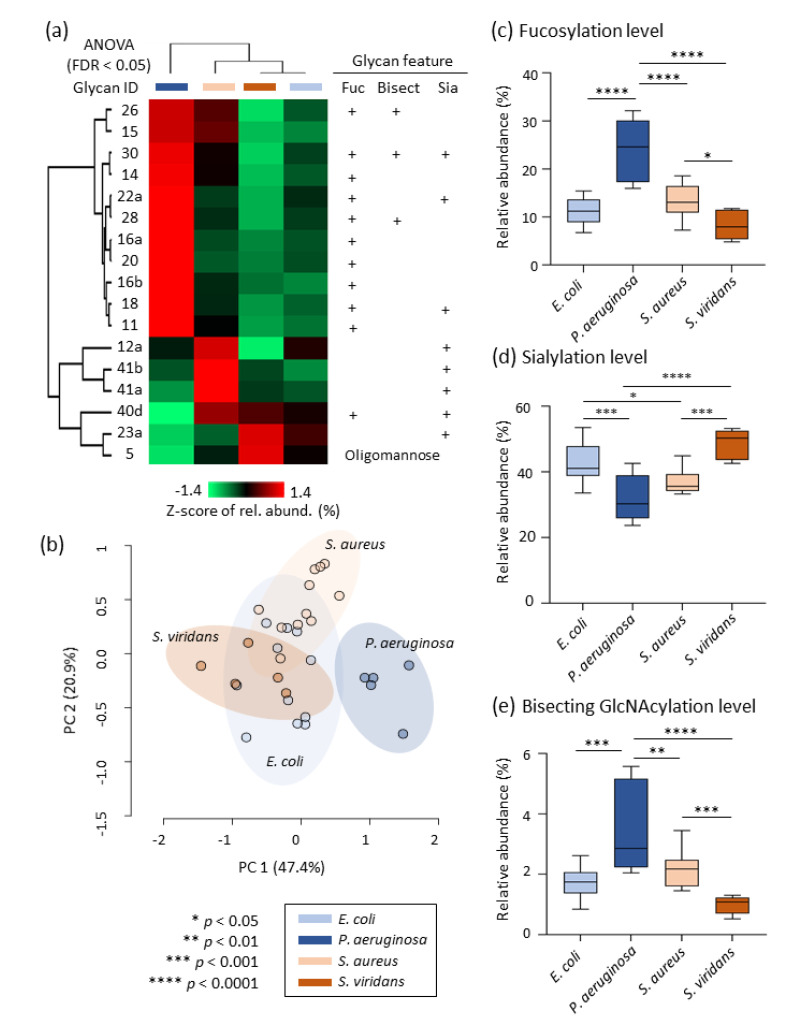
Figure 5.
Pathogen-specific alterations of the serum N-glycome. (a) Heat-map representation illustrating the quantitative profile of selected glycans after Z-score transformation of the relative abundance data and cluster analysis using Euclidean distance and average linkage performed with Perseus. The selected glycans were a panel of 17 glycan isomers that were found to be differentially abundant in serum across the bacteremic patient groups (ANOVA followed by FDR correction, p < 0.05). Key structural features are indicated for these glycans. The P. aeruginosa-infected individuals displayed a starkly different serum N-glycome profile relative to other bacteremic patients. (b) Unsupervised PCA performed with the Metaboanalyst software using untransformed relative abundance data of the panel of 17 glycan isomers as input demonstrating a complete separation of P. aeruginosa-infected individuals from the other bacteremic patient groups. The P. aeruginosa-infected individuals displayed aberrant levels of (c) fucosylation, (d) sialylation, and (e) bisecting GlcNAcylation (ANOVA and Fisher’s LSD, p < 0.05).

