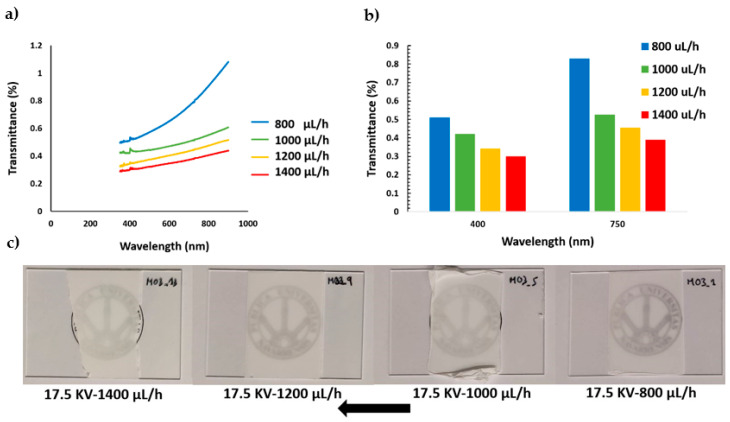
Figure 10.
(a) UV/vis spectra of the resultant PVDF fibers for a fixed voltage (17.5 KV) and different flow rates (800, 1000, 1200, 1400 µL/h); (b) transmittance change at a specific wavelength of the visible region at 400 nm and 750 nm; (c) electrospun samples S1, S5, S9, and S13 appearance onto standard glass slides.

