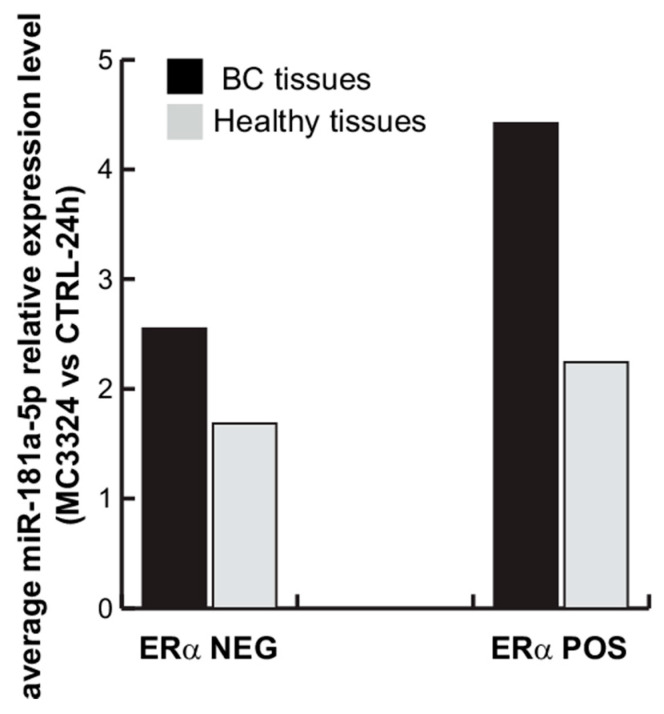
Figure 8.
Average miR-181a-5p relative expression levels in 18 BC and healthy primary tissues (MC3324 vs. CTRL; 24 h). Grouping ERα-positive patients (pt #1–3, 5, 6, 9–12, 15–18) and ERα-negative patients (TNBC and tumors with at least positivity for progesterone (PR) and/or HER2; pt #4, 7, 8, 13, 14).

