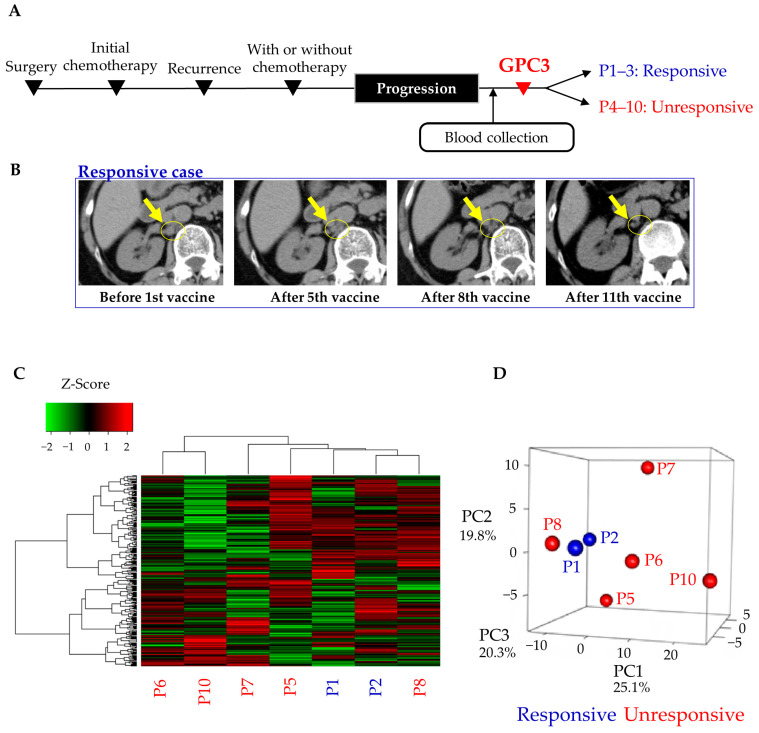
Figure 3.
Comprehensive serum miRNA sequencing in the progression group. (A) Time line chart of the remission group; (B) representative images of a responsive case. A computed tomography scan showed that paraaortic lymph node metastases shrunk with GPC3 peptide vaccine treatment in the P2 case; (C,D) heatmap and principal component analysis of serum miRNA profiles. Blue and red letters indicate responsive (P1 and P2) and unresponsive (P5–8 and P10) cases, respectively. P3, P4, and P9 were excluded because of low read counts. P, progression.

