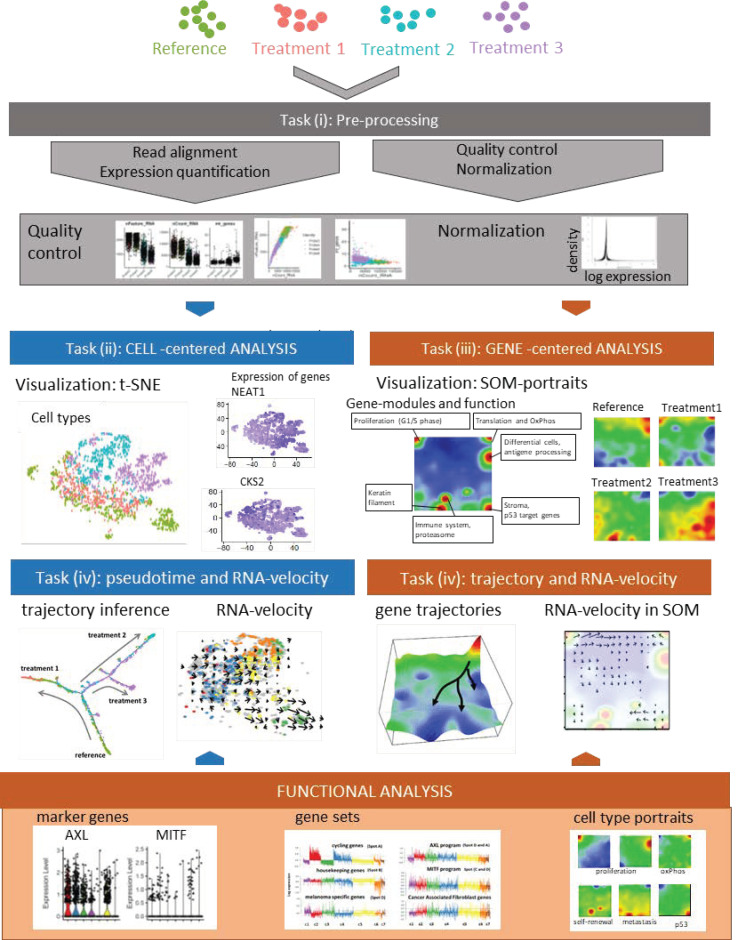
Figure 1.
Principles of single-cell analyses based on melanoma cells analyses: A schematic representation of single-cell analyses is shown. Analysis starts with classical read alignment and quality control and normalization measures as in bulk RNA-seq. Subsequent analysis of transcriptomic cell clusters is performed by t-distributed stochastic neighbor embedding (t-SNE) as described in the text. Individual genes (NEAT1, CKS2) may be mapped onto clonal structures. Alternatively, self-organizing maps may be chosen, which represents a gene-based clustering method of cellular subclones. Pseudotime dynamics shows different trajectories of treatment resistance under three different treatment conditions which may also be demonstrated by RNA-velocity analysis. Marker genes for treatment resistance are found in different subclones and are part of larger gene sets or cell type portraits.

