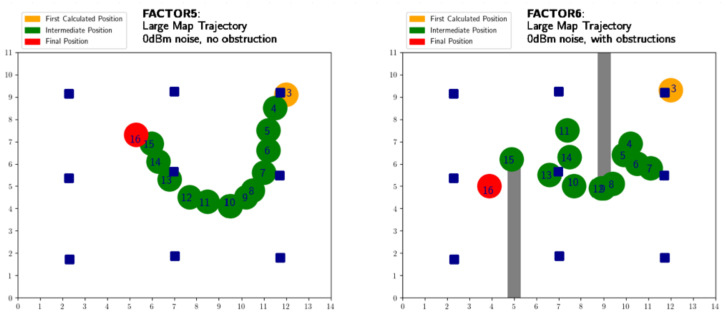
Figure 4.
The OASLTool displays the trajectory, obstructions and placement of the receivers in the environment. Blue squares show the placement of receivers; the orange circle is the first predicted position of the tag; green circles with numbers show the intermediate time-steps; the red circle marks the end of trajectory. Gray blocks represent the concrete obstructions in the environment, such as walls. The axes show the dimensions of the environment in meters.

