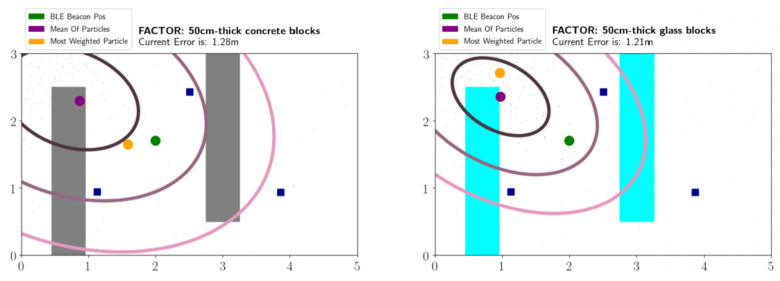
Figure 5.
The OASLTool displays the particle filter tracking results in an animated manner. Blue squares show the placement of receivers; the green circle shows the actual position of the tag; the orange circle is the particle with the maximum weight; the purple circle is the weighted mean of the particles, which is used as the predicted position. The ellipses visualize the covariance of the particles.

