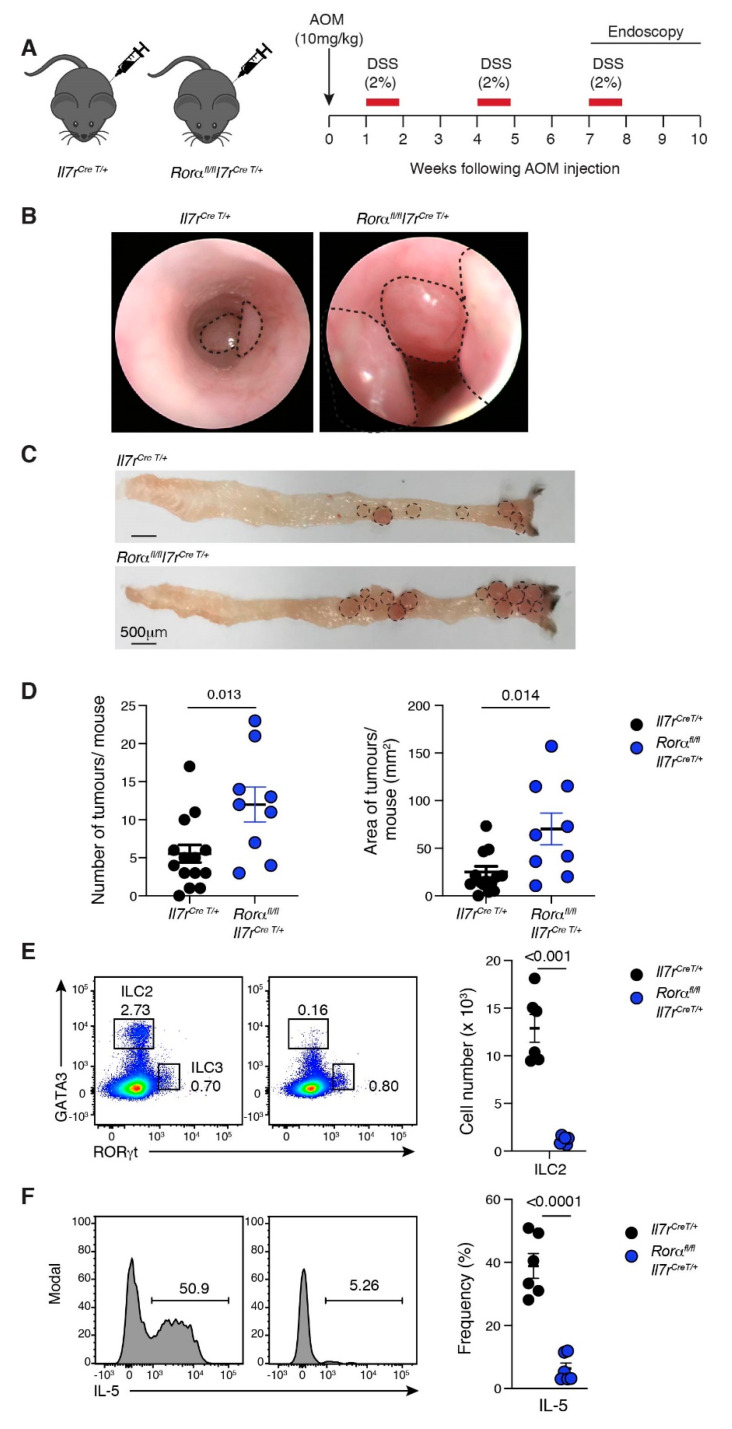
Figure 3.
Loss of ILC2 augments CAC. (A) Schematic illustration of the AOM/DSS treatment protocol. Il7rCre T/+ and Rorαfl/flIl7rCre T/+ mice injected with AOM (10 mg/kg, i.p) followed by three five-day cycles of 2% (w/v) DSS ad libitum in their drinking water separated by two weeks of normal water between each cycle. Colonic tumours developed between 7–10 weeks after the commencement of treatment. (B) Endoscopic images of AOM/DSS-treated Il7rCre T/+ and Rorαfl/flIl7rCre T/+ mice (right panel). Images are representative of two independent experiments (n = 9–15 mice/genotype/experiment). Dotted lines indicate colonic tumours. (C) Representative whole mount images of colons from Il7rCre T/+ and Rorαfl/flIl7rCre T/+ mice treated with AOM+DSS. Images are representative of two to five mice/genotype analysed in two separate experiments. Dotted lines indicate tumour size and location. Scale bar: 500 μm. (D) Number (left panel) and area of tumours (mm2, right panel) per mouse in Il7rCreT/+ and Rorαfl/flIl7rCre T/+ mice treated with AOM+DSS. Each dot represents one mouse—closed circle for female. Data show the mean ± s.e.m (n = 2–5 mice/genotype/experiment) pooled from two independent experiments. Statistical differences were analysed using the Mann–Whitney nonparametric test. p-values are indicated. (E) Representative flow cytometric colour plots (left panels) and enumeration (right panels) of ILC2 subsets isolated from the colon of AOM+DSS-treated Il7rCre T/+ and Rorαfl/flIl7rCre T/+ mice. Each dot represents one mouse. Data show the mean ± s.e.m. pooled from two independent experiments (n = 3 mice/genotype/experiment). Statistical differences were calculated using an unpaired Student’s t-test. p-values are indicated. (F) Representative histograms (left panels) and frequency (right panel) of cytokine-producing ILC2 isolated from the colon of AOM+DSS-treated Il7rCre T/+ and Rorαfl/flIl7rCre T/+ mice. Each dot represents one mouse. Data show the mean ± s.e.m. pooled from two independent experiments (n = 3 mice/genotype/experiment). Statistical differences were calculated using an unpaired Students t-test, p-values are indicated.

